

25 Hydropower Stocks with Double Bottom Patterns in NEPSE
25 Hydropower Stocks Showing Double Bottom Patterns in NEPSE: A Technical Analysis Watchlist for Nepal Investors
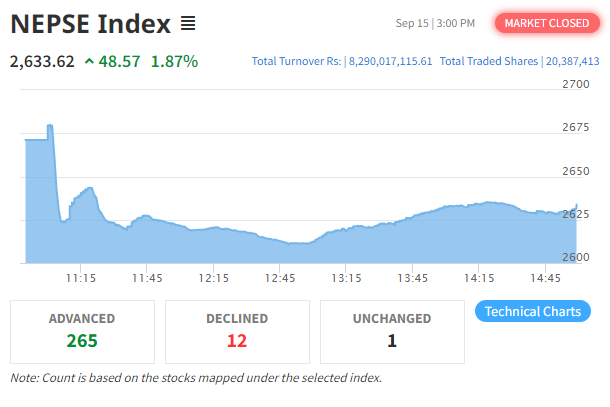
NEPSE Market Rising? Don't Rush to Buy—Search for Better Setups
When the Nepal stock market starts moving higher, many investors become worried that they are missing the opportunity.
The natural reaction is often:
“The market is going up. Which stock should I buy now?”
But a rising market does not mean investors should blindly chase stocks.
Instead of rushing into a company because its price is moving, investors can use technical analysis, support levels, chart patterns, volume and fundamental analysis to identify stocks that may offer more attractive setups.
One technical pattern worth studying is the Double Bottom.
Based on the accompanying technical-analysis watchlist, 25 hydropower companies are shown with a Double Bottom pattern and a bullish trend indication. This can be used as a starting point for further research—not as a direct buy recommendation.
For investors who want to learn how to analyze NEPSE charts and companies independently, Sarbaguna Share Market Training Nepal provides practical education covering technical analysis, fundamental analysis, support and resistance, chart patterns and risk management.
What Is a Double Bottom Pattern?
A Double Bottom is a technical chart pattern that can indicate a potential reversal from a declining trend toward an upward move.
The pattern generally develops when price:
- Falls toward a support area.
- Finds buying interest and rebounds.
- Returns toward a similar support zone.
- Holds that area again.
- Attempts to move higher, potentially confirming a reversal after breaking the neckline/resistance area.
The important point is that a Double Bottom by itself does not guarantee that a stock will rise.
Traders should look for confirmation through factors such as:
- Price action
- Support and resistance
- Trading volume
- Breakout confirmation
- Market trend
- Sector strength
- Company fundamentals
- Risk-reward ratio
25 Hydropower Stocks Showing Double Bottom Patterns
The following companies are visible in the supplied NEPSE technical-analysis watchlist.
| S.N. | Symbol | LTP | Change | Pattern | Trend |
|---|---|---|---|---|---|
| 23 | PMHPL | 302.8 | +1.61% | Double Bottom | Bullish |
| 19 | UPCL | 332.8 | +0.51% | Double Bottom | Bullish |
| 18 | UNHPL | 350.4 | +1.01% | Double Bottom | Bullish |
| 11 | NYADI | 351.9 | +2.30% | Double Bottom | Bullish |
| 6 | CHCL | 352.1 | +1.76% | Double Bottom | Bullish |
| 1 | AHL | 359 | +2.51% | Double Bottom | Bullish |
| 20 | VLUC L | 378 | +1.07% | Double Bottom | Bullish |
| 10 | NGPL | 397.4 | +1.90% | Double Bottom | Bullish |
| 8 | MAKAR | 402 | +0.50% | Double Bottom | Bullish |
| 15 | SMJC | 405 | +0.27% | Double Bottom | Bullish |
| 2 | BHDC | 417 | +1.29% | Double Bottom | Bullish |
| 22 | KPCL | 454 | +1.91% | Double Bottom | Bullish |
| 9 | MHL | 455 | +2.50% | Double Bottom | Bullish |
| 25 | SMHL | 462 | +0.65% | Double Bottom | Bullish |
| 24 | SMH | 502 | +1.33% | Double Bottom | Bullish |
| 17 | UMRH | 514.9 | +0.18% | Double Bottom | Bullish |
| 5 | BUNGAL | 520 | +0.97% | Double Bottom | Bullish |
| 16 | UMHL | 544.9 | -1.39% | Double Bottom | Bullish |
| 21 | YMHL | 555.1 | -0.70% | Double Bottom | Bullish |
| 7 | DHEL | 556 | +2.34% | Double Bottom | Bullish |
| 14 | RURU | 582 | 0.00% | Double Bottom | Bullish |
| 12 | NHDL | 628.9 | +1.76% | Double Bottom | Bullish |
| 4 | BPCL | 642 | +0.47% | Double Bottom | Bullish |
| 3 | BJHL | 657 | +1.39% | Double Bottom | Bullish |
| 13 | RADHI | 692 | +2.22% | Double Bottom | Bullish |
Important: The prices and percentage changes above reflect the supplied image/watchlist and should be treated as a snapshot, not live market data.
Should You Buy These Stocks?
Not simply because they appear on a Double Bottom list.
A technical pattern is a screening tool, not a complete investment decision.
If you are considering any of these hydropower stocks, perform additional analysis before investing.
A practical checklist is:
1. Check the Support Level
Identify where the stock previously attracted buyers.
A support zone can help you understand where the market has historically shown buying interest.
2. Check the Double Bottom Formation
Look at whether the two lows are reasonably well-defined and whether the pattern is actually developing around a meaningful support zone.
3. Watch the Neckline
The area between the two bottoms often creates an important resistance or neckline.
A breakout above this area, especially with stronger volume, can provide greater confirmation than simply seeing two lows.
4. Analyze Trading Volume
Volume can provide additional information about market participation.
A price breakout accompanied by stronger volume can be more meaningful than a breakout occurring on very weak volume.
5. Check the Overall NEPSE Trend
A stock's chart should not be analyzed completely in isolation.
Consider:
- NEPSE trend
- Hydropower sector movement
- Market sentiment
- Liquidity
- Broader market momentum
6. Study the Company's Fundamentals
This is particularly important for investors planning to hold a company for a longer period.
Consider:
- Earnings per share
- Net profit
- Revenue
- Book value
- Debt
- Cash flow
- Return on equity
- Dividend history
- Project status
- Production capacity
- Promoter/public share structure
- Sector conditions
You Don't Need to Analyze Every Company in the Market
One common mistake among new investors is trying to understand every listed company before making a decision.
That isn't necessary.
If you have a list of 25 technically interesting stocks, you can narrow it down.
For example:
Step 1: Screen for a Double Bottom pattern.
Step 2: Remove companies where the chart structure is weak.
Step 3: Compare volume and breakout strength.
Step 4: Study the fundamentals of the companies that remain.
Step 5: Compare valuation and risk.
Step 6: Decide whether the setup fits your investment plan.
This approach can be much more practical than randomly buying whichever stock is moving strongly on a particular day.
Technical Analysis + Fundamental Analysis
The strongest approach is often to combine technical and fundamental analysis rather than depending entirely on one method.
Technical analysis can help answer:
- Where is the support?
- Where is resistance?
- Is the trend bullish or bearish?
- Is there a breakout?
- What does volume indicate?
- Where could an entry or exit be considered?
Fundamental analysis can help answer:
- Is the company financially healthy?
- Is the valuation reasonable?
- Are earnings improving?
- Is debt manageable?
- What is the company's long-term business outlook?
- How strong is the sector?
For investors in Nepal, learning both approaches can help develop a more structured method of analyzing NEPSE-listed companies.
Sarbaguna's investment training covers fundamental analysis, technical analysis, financial statements, EPS, P/E, book value, support and resistance, chart patterns and risk management.
Don't Chase the Market Because It Is Rising
When the market rises rapidly, FOMO—fear of missing out—can become dangerous.
Investors may start buying stocks simply because:
- The price is rising.
- Someone posted a target price.
- Friends are buying.
- Social media is talking about the stock.
- The NEPSE index is increasing.
- They believe they are already late.
Instead, ask:
“What is my investment thesis?”
“Where is my support?”
“What confirms this setup?”
“What is the downside if I am wrong?”
“Have I checked the company's fundamentals?”
This shift from emotion to analysis is an important part of becoming a disciplined investor.
For New Investors: These Stocks Can Be a Starting Point for Research
If you are a beginner looking for potential stocks in Nepal, a technical watchlist such as this can be useful as a research starting point.
However, being listed on a technical screen does not mean:
- The company is automatically undervalued.
- The stock will definitely rise.
- The Double Bottom will definitely succeed.
- The stock is suitable for every investor.
- You should buy immediately.
Instead, use the list to identify companies that deserve deeper research.
Learn NEPSE Technical Analysis Before Following Stock Tips
If you regularly find yourself asking:
“Which share should I buy?”
a better long-term question may be:
“How can I analyze a share myself?”
Learning technical analysis can help you understand:
- Candlestick patterns
- Double Bottom
- Double Top
- Support and resistance
- Trendlines
- Breakouts
- Volume
- RSI
- MACD
- Moving averages
- Price action
- Risk-reward
- Entry and exit planning
Sarbaguna's NEPSE and Share Market Training programs are designed around practical Nepal-market education for beginners, investors and traders.
Final Takeaway
बजार बढ्यो भनेर चिन्ता गरेर दौडिनु पर्दैन।
The market going up does not mean you have to buy immediately.
Instead:
Search → Screen → Analyze → Confirm → Manage Risk → Decide
The 25 hydropower stocks shown above may provide a useful technical-analysis watchlist, particularly because the supplied screen identifies a Double Bottom pattern with a bullish trend.
But remember:
A chart pattern is a starting point for research—not a guarantee of profit.
Before buying any stock, combine technical analysis with fundamental analysis, understand your risk, and make decisions according to your own investment objectives.
Education Purpose Only: This article is for educational and informational purposes only. It is not personalized investment advice, a buy/sell recommendation, or a guarantee of future returns. Stock-market investing involves risk, and investors should conduct their own research or consult a qualified financial professional.
Frequently Asked Questions — Double Bottom Stocks in Nepal
1. What is a Double Bottom pattern in NEPSE?
A Double Bottom is a technical chart pattern that generally forms when price tests a support area twice and subsequently attempts to move upward. Traders often look for confirmation through a neckline breakout, price action and volume.
2. Which hydropower stocks are showing Double Bottom patterns?
The supplied technical-analysis watchlist shows 25 hydropower companies with a Double Bottom pattern and bullish trend indication, including PMHPL, UPCL, UNHPL, NYADI, CHCL, AHL, NGPL, KPCL, MHL, SMHL, BPCL, BJHL and RADHI.
3. Does a Double Bottom mean I should buy the stock?
No. A Double Bottom is a technical setup, not a guaranteed buy signal. Investors should consider breakout confirmation, volume, support, resistance, fundamentals, valuation and risk management.
4. Is Double Bottom bullish?
A Double Bottom is generally interpreted as a potentially bullish reversal pattern, particularly when price confirms the pattern by moving above the relevant resistance or neckline.
5. Why is volume important in a Double Bottom?
Volume can help assess the strength of a price move. Traders may look for stronger participation during a breakout because it can provide additional confirmation.
6. Should beginners buy hydropower stocks in Nepal?
Beginners should first understand NEPSE, technical analysis, fundamental analysis and risk management. A technical screen should be used for research rather than as an automatic buying signal.
7. What should I check before buying a hydropower stock?
Consider the company's earnings, debt, cash flow, book value, valuation, project status, production capacity, dividend history, sector outlook, price trend, support, resistance and trading volume.
8. Can technical analysis guarantee profit?
No. Technical analysis cannot guarantee profits. Market prices can move unexpectedly, and every trading or investment strategy carries risk.
9. Where can I learn technical analysis in Nepal?
You can explore Sarbaguna's Share Market Training Nepal for practical education covering technical analysis, fundamental analysis, chart patterns, support and resistance, risk management and NEPSE market analysis.
10. How can I contact Deep Thapa for share market training?
For information about Share Market Training Nepal, NEPSE technical analysis and investment education, contact Deep Thapa.
Call / WhatsApp: 9849290806
Learn Share Market Analysis in Nepal
If you want to move beyond simply following stock tips and learn how to analyze NEPSE stocks yourself, explore:
- Share Market Training Nepal
- NEPSE & Technical Analysis Training
- Investment Training Nepal – Fundamental Analysis
- Support & Resistance in NEPSE
Contact: Deep Thapa
Call / WhatsApp: 9849290806
Learn. Analyze. Invest. Manage Risk.


Leave a Comments
Comments
Popular






Recent Post
No comments yet.