

NEPSE Technical Analysis: 20MA & 50% Fibonacci Support | Market Outlook
NEPSE Technical Analysis: 20-Day Moving Average and 50% Fibonacci Retracement Hold Key Support
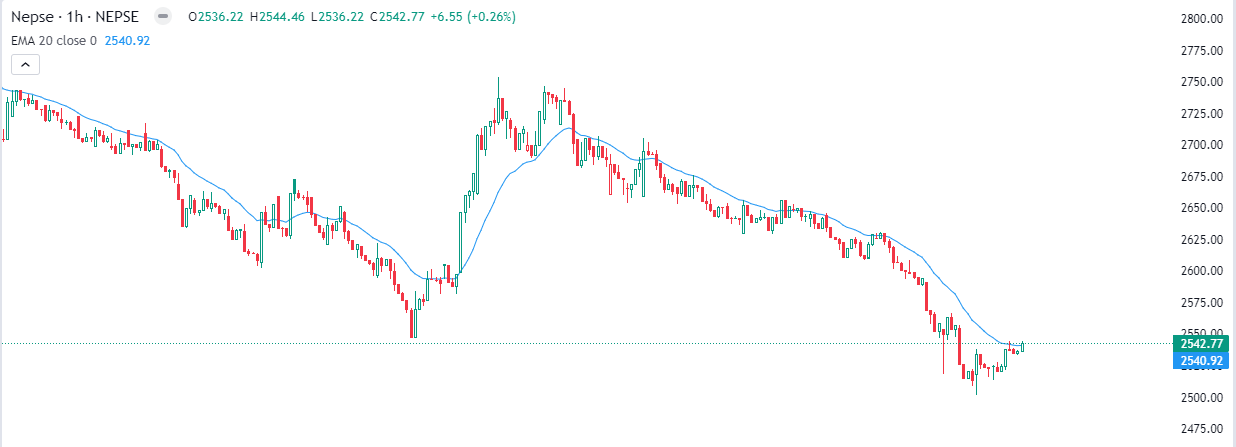
The Nepal Stock Exchange (NEPSE) continues to show mixed technical signals as the market attempts to find support around its 20-day moving average (20MA) middle Bollinger Band and the 50% Fibonacci retracement level.
From a technical perspective, the market has so far managed to hold these important support zones reasonably well. However, the latest candlestick action has weakened the bullish signal that appeared in the previous trading session.
NEPSE Market Analysis: Bullish Tweezer Bottom Fails to Confirm
A potentially bullish Tweezer Bottom candlestick pattern was formed during the previous trading session. Such a pattern can indicate that selling pressure is weakening and that buyers may attempt to regain control.
However, today's candle failed to provide the confirmation required to validate the previous bullish pattern.
As a result, the earlier Tweezer Bottom setup has effectively been invalidated, increasing the possibility that the prevailing short-term downtrend could continue.
For traders following NEPSE technical analysis, the market's ability to hold the 20MA middle band remains particularly important.
20MA Middle Band and 50% Fibonacci Retracement
The 20-day moving average (20MA) is currently acting as an important dynamic support area. At the same time, the 50% Fibonacci retracement level has also provided support.
These two technical references create an important support zone for the NEPSE index.
If the market continues to hold this area, buyers may get another opportunity to build momentum. Conversely, a decisive breakdown below the middle band could increase selling pressure and expose the market to lower support levels.
For investors learning technical analysis, combining moving averages, Fibonacci retracement, candlestick patterns and volume can provide a broader view than relying on a single indicator.
ADX Indicates a Weakening Trend
The Average Directional Index (ADX) is currently moving toward the downside, suggesting that the strength of the existing trend is weakening.
It is important to note that ADX primarily measures trend strength rather than trend direction. Therefore, a declining ADX can indicate that the current trend is losing momentum, but it does not independently confirm a bullish reversal.
Traders should therefore monitor ADX alongside price action, support and resistance, moving averages and volume.
NEPSE Intraday Movement: Gap-Up Opening and Gap Fill
Today's market opened with a gap-up, but the gap was filled within the first minute of trading.
The market subsequently experienced several important intraday movements.
At around 11:50 AM, the NEPSE index recorded the day's low and then started moving upward. This recovery continued until approximately 1:34 PM, when the market recorded its intraday high.
After reaching the day's high, however, the index experienced an aggressive decline.
The selling pressure became particularly noticeable after 2:00 PM, continuing a pattern where late-session supply has repeatedly affected the market.
This late-session selling remains an important area for traders to monitor in upcoming sessions.
NEPSE Trading Volume and Market Participation
Today's trading activity remained around a similar level to the previous session.
Volume is an important confirmation tool in technical analysis. A sustained recovery accompanied by stronger volume could provide more confidence in a bullish move, while a breakdown supported by increasing volume could indicate stronger selling pressure.
Therefore, traders should watch both price and volume rather than interpreting price movement in isolation.
Top 10 Brokers: Buying Pressure Remains Visible
An analysis of transactions involving the 10 major brokers shows that 7 of the 10 brokers purchased more than they sold during the session.
This indicates that buying activity among several major brokers remained relatively strong despite the weakness seen toward the end of the trading session.
However, broker-wise activity should be interpreted alongside overall market volume, price action and broader market sentiment rather than being treated as an independent buy or sell signal.
Key Technical Signals to Watch
For the next trading session, traders may want to monitor the following technical factors:
- 20MA / Bollinger Band Middle: Key dynamic support
- 50% Fibonacci Retracement: Important retracement support
- Tweezer Bottom: Previous bullish signal now lacking confirmation
- ADX: Indicates weakening trend strength
- Volume: Similar to the previous session
- Late-session selling: Important risk factor after 2:00 PM
- Major Broker Activity: 7 of the top 10 brokers recorded higher buying than selling
The most important question for the market now is whether the 20MA middle band can continue to hold as support.
A sustained hold could allow the market to attempt another recovery, while a decisive breakdown could increase the possibility of further downside movement.
NEPSE Outlook: What Traders Should Watch Next
Technically, the market remains at an important decision point.
The combination of support around the 20MA middle band and 50% Fibonacci retracement provides a technical foundation for a potential recovery. However, the failure of the previous session's Tweezer Bottom pattern to receive confirmation means traders should remain cautious about assuming an immediate bullish reversal.
The market's next direction will likely depend heavily on:
- Whether the 20MA middle band holds.
- Whether the 50% Fibonacci retracement remains intact.
- Whether selling pressure continues after 2:00 PM.
- Whether volume expands during a breakout or breakdown.
- Whether ADX continues to weaken.
- Whether major brokers maintain stronger buying activity.
This makes the upcoming sessions particularly important for NEPSE traders and stock market investors in Nepal.
Learn Technical Analysis and Forex Trading in Nepal
Understanding candlestick patterns, Fibonacci retracement, moving averages, ADX, Bollinger Bands, volume and market psychology can help traders develop a more structured approach to financial markets.
If you are looking for Share Market Training in Nepal, NEPSE Technical Analysis Course, or a Forex Trading Course in Nepal, Sarbaguna provides market-focused learning resources covering technical analysis, trading strategies, risk management and market behavior.
Explore Sarbaguna's Share Market Training in Nepal and learn more about the Forex Trading Course in Nepal.
For training and market-related information, contact Deep Thapa.
Call / WhatsApp: 9849290806
Frequently Asked Questions (FAQ)
What is the current technical support for NEPSE?
The 20-day moving average (20MA) middle Bollinger Band and the 50% Fibonacci retracement are currently important technical support references for the NEPSE index.
What is a Tweezer Bottom pattern?
A Tweezer Bottom is a bullish candlestick reversal pattern that generally appears after a decline and can indicate that selling pressure is weakening. Confirmation from subsequent price action is important before treating the pattern as a valid reversal signal.
Was the previous Tweezer Bottom confirmed?
No. The following day's candle failed to provide the expected bullish confirmation, weakening and effectively invalidating the previous Tweezer Bottom setup.
What does ADX indicate in the current NEPSE market?
ADX measures trend strength rather than direction. The current decline in ADX suggests that the strength of the prevailing trend is weakening.
Why is the 20MA important for NEPSE?
The 20-day moving average is widely used to identify short- to medium-term market trends and dynamic support or resistance. A sustained hold can support a recovery attempt, while a breakdown may increase downside pressure.
What does the 50% Fibonacci retracement mean?
The 50% Fibonacci retracement is a commonly watched technical level that traders use to assess whether a market correction is finding support after a previous price movement.
What happened to the NEPSE gap-up opening?
The market opened with a gap-up, but the opening gap was filled during the first minute of trading.
What happened after 2:00 PM?
Selling pressure increased after 2:00 PM, contributing to an aggressive decline after the market had already reached its intraday high around 1:34 PM.
What did the top 10 brokers show?
Seven of the 10 major brokers recorded higher buying than selling during the session, indicating relatively strong buying participation among several major brokers.
Where can I learn NEPSE technical analysis in Nepal?
Sarbaguna offers resources and training related to NEPSE technical analysis, share market trading, fundamental analysis and Forex trading in Nepal.
For course information, contact Deep Thapa at 9849290806 by call or WhatsApp.
Disclaimer: This article is for educational and informational purposes only. Technical indicators and broker activity do not guarantee future market movements. Investors should conduct their own research and consider their risk tolerance before making investment decisions.


Leave a Comments
Comments

Popular






No comments yet.