

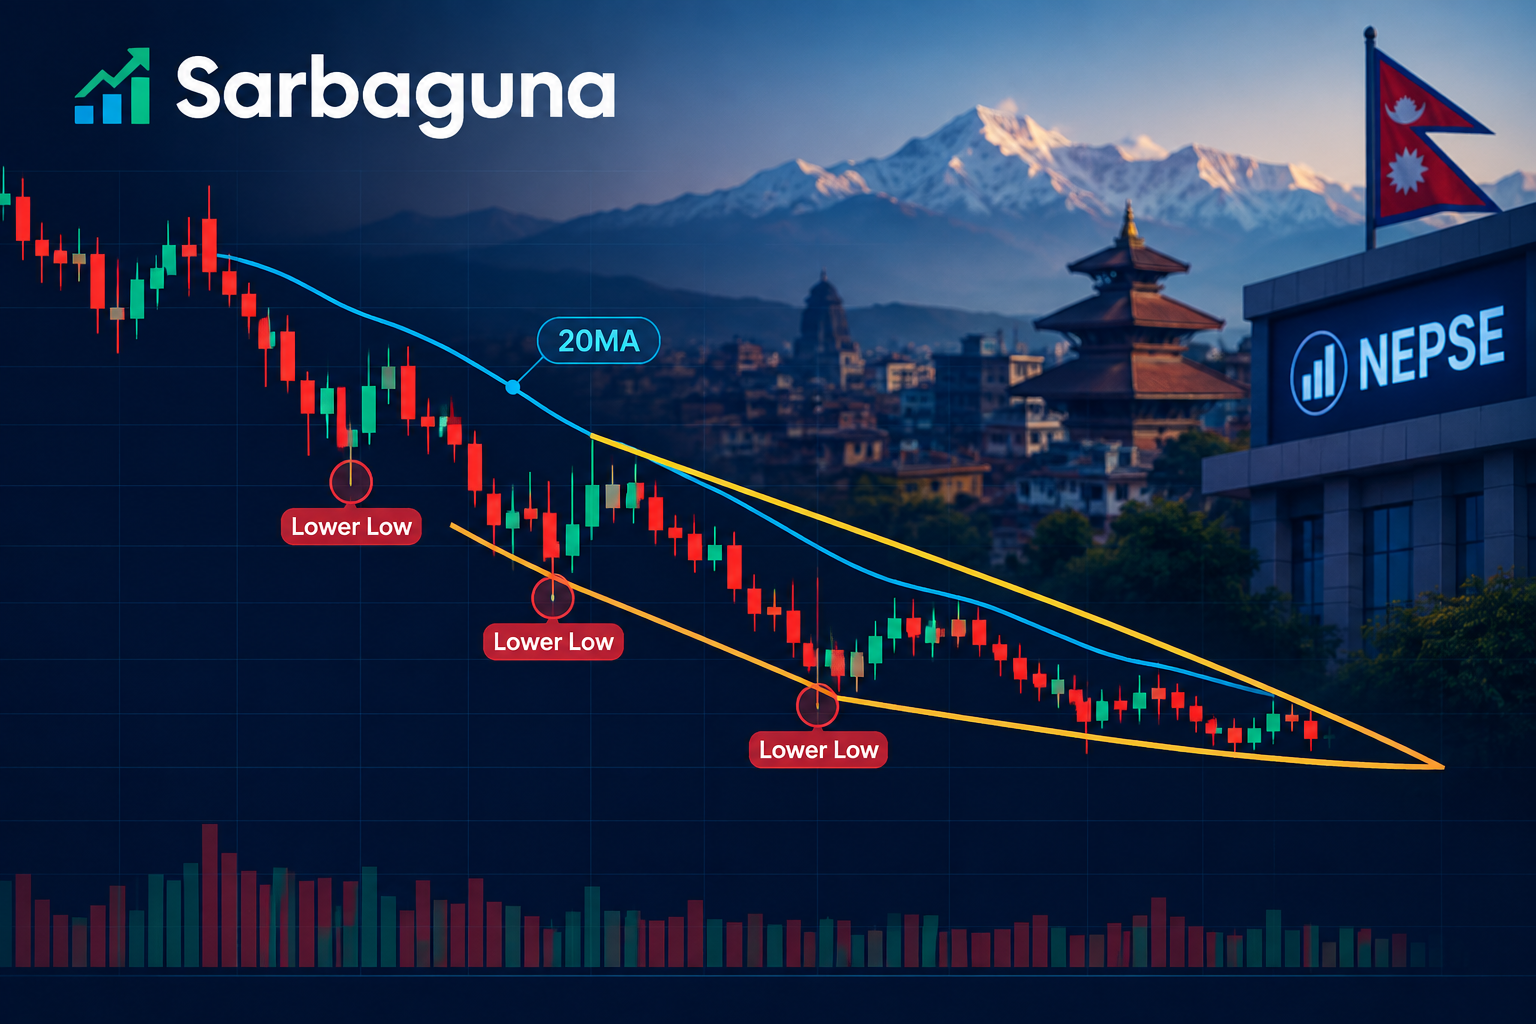
NEPSE Technical Analysis: Lower Low, 20MA Breakdown & Falling Wedge Support
NEPSE Technical Analysis: Lower-Low Formation Raises Risk of Further Selling Pressure
NEPSE Market Analysis: Lower-Low Candle, 20-Day Moving Average and Falling Wedge Support
The NEPSE index is showing signs of technical weakness after forming a Lower Low (LL) candle. The market has broken below both the Middle Bollinger Band (20-day moving average) and the 50% Fibonacci retracement level, although the index remains close to these important technical levels.
The next trading candle will be particularly important. If the market forms another Lower Low (LL) candle and confirms the breakdown, selling pressure could increase and potentially trigger a stronger wave of panic selling. This possibility cannot be ruled out based on the current technical structure.
However, traders should also monitor whether the NEPSE index can reclaim the broken technical levels. A failed breakdown followed by a recovery above the 20-day moving average could change the short-term structure.
Falling Wedge Support Could Become Critical
If the market produces another confirmation candle with a Lower Low after breaking below the Middle Bollinger Band, the support trendline of the falling wedge pattern could become one of the most important support zones to watch.
The falling wedge support trendline may provide a technical area where buyers could attempt to defend the market.
Therefore, the upcoming sessions could be important for determining whether the current weakness develops into a deeper correction or whether the market finds support around the falling wedge trendline.
For traders following NEPSE technical analysis, the reaction around this support area should be monitored carefully.
ADX Shows a Downtrend but Trend Strength Remains a Key Factor
The Average Directional Index (ADX) is currently indicating a downtrend structure. However, the ADX reading also suggests that the existing trend is not particularly aggressive at this stage.
This distinction is important.
A downtrend accompanied by a rapidly strengthening ADX could indicate that selling pressure is becoming more powerful. On the other hand, if the ADX remains relatively weak, the market could continue moving lower without developing into an aggressive directional decline.
Therefore, traders should monitor whether ADX begins rising strongly while the bearish trend continues.
An increase in ADX together with continued Lower Highs and Lower Lows could indicate strengthening downside momentum.
Intraday Market Structure: Lower Highs and Lower Lows
The market opened with a small gap down and initially moved upward.
The intraday high was recorded around 11:47 AM. After reaching the day's high, however, the NEPSE index remained largely in a pattern of Lower Highs (LH) and Lower Lows (LL) throughout the trading session.
The day's low was recorded around 2:52 PM.
After making the intraday low, the market recovered slightly before closing.
This price structure indicates that sellers maintained control for a significant portion of the trading session, particularly during the afternoon.
Aggressive Selling After 2 PM
As has been observed in several recent sessions, the market again displayed relatively aggressive downside movement after 2:00 PM.
More importantly, trading activity was also significant during this period.
The NEPSE recorded approximately Rs. 4.29 billion in total turnover, while around Rs. 1.83 billion was traded during the final hour alone.
That means approximately 43% of the day's total turnover occurred during the final trading hour.
Why Is This Important?
A combination of:
- Falling prices
- Increasing trading activity
- Heavy turnover during the decline
- Lower High and Lower Low formation
is generally an important technical condition to monitor.
When substantial volume accompanies a market decline, traders should pay attention to whether the selling represents distribution or short-term liquidation.
If this pattern continues over subsequent sessions, it could indicate that selling pressure is becoming more significant.
However, a single trading session should not be interpreted in isolation. Confirmation from subsequent price action, volume and technical indicators is important.
Trading Volume and Market Sentiment
Today's turnover was slightly lower than the previous trading session.
Despite the lower overall turnover, the concentration of trading activity toward the final hour is notable.
Around 43% of the total daily turnover occurred during the last hour, while the market was simultaneously moving lower.
This combination deserves close attention in the next session.
If the market continues to decline with increasing volume, the bearish structure could gain further confirmation. Conversely, if the market stabilizes and volume decreases during the decline, it could indicate that immediate selling pressure is losing momentum.
Top 10 Brokers: Balanced Buying and Selling
The transaction activity of the 10 major brokers shows a relatively balanced picture.
The data indicates approximately five brokers on the buying side and five brokers on the selling side.
This suggests that the major-broker activity does not currently provide a clear one-sided signal.
Therefore, broker activity should be considered alongside price structure, volume, support and resistance levels rather than as an independent market signal.
Key Technical Levels to Watch
Based on the current chart structure, traders can monitor the following technical areas:
1. 20-Day Moving Average / Middle Bollinger Band
The Middle Bollinger Band, based on the 20-day moving average, is an important short-term trend reference.
A sustained recovery above this level could weaken the immediate bearish structure, while continued trading below it could maintain downside pressure.
2. 50% Fibonacci Retracement
The 50% Fibonacci retracement level has also been broken.
The market's reaction around this level will be important because a failed recovery could turn the previous support area into resistance.
3. Falling Wedge Support Trendline
If another Lower Low is confirmed, the falling wedge's lower support trendline could become a critical technical support area.
4. Lower-Low Confirmation
Another LL candle would provide additional confirmation of the current bearish price structure.
5. Volume Confirmation
Volume should be monitored closely. A further decline accompanied by increasing turnover could indicate stronger selling participation.
What Could Happen Next in NEPSE?
The next few trading sessions could provide important confirmation for the market's short-term direction.
There are two broad technical possibilities:
Bearish confirmation:
If NEPSE forms another Lower Low, remains below the 20-day moving average and 50% Fibonacci retracement, and selling volume increases, the market could face additional downside pressure.
Support and recovery:
If the index finds support near the falling wedge trendline and starts recovering with improving market breadth and volume behavior, the current breakdown could prove to be a temporary weakness.
For this reason, traders should avoid relying on a single indicator. Price action, ADX, volume, Bollinger Bands, Fibonacci retracement and chart patterns should be evaluated together.
NEPSE Technical Analysis Conclusion
Technically, the market is currently showing a Lower Low structure, while the 20-day moving average and 50% Fibonacci retracement have also been breached.
The next Lower Low confirmation candle could increase selling pressure and raise the possibility of panic selling. At the same time, the falling wedge support trendline remains an important technical area to watch if the market continues lower.
The ADX indicates a downtrend, but the trend has not yet demonstrated an extremely aggressive strength. The key concern would be a scenario in which NEPSE continues making Lower Lows while ADX rises significantly.
The concentration of approximately 43% of daily turnover in the final hour, combined with a decline in the index, is another factor that deserves attention.
Traders should therefore closely monitor the next session's LL/LH structure, volume, ADX, 20MA, 50% Fibonacci retracement and falling wedge support before drawing conclusions about the next major market move.
Disclaimer: This article is for educational and informational purposes only. Technical indicators and chart patterns do not guarantee future market movements. Investors and traders should conduct their own research and consider their risk tolerance before making financial decisions.
Learn NEPSE Technical Analysis and Forex Trading in Nepal
Want to understand NEPSE technical analysis, price action, support and resistance, Fibonacci retracement, moving averages, ADX, chart patterns and trading psychology?
Explore Share Market Training in Nepal and the Forex Trading Course in Nepal through Sarbaguna. Learn how to analyze market trends, identify important technical levels and develop a structured trading approach.
For NEPSE technical analysis, share market training, stock market education and Forex trading course in Nepal, contact Deep Thapa.
Call / WhatsApp: 9849290806
Sarbaguna – Learn, Analyze and Trade Smarter.


Leave a Comments
Comments



Popular






No comments yet.