

NEPSE Weekly Analysis: Index Gains 4.55 Points
NEPSE Weekly Analysis: Index Rises 4.55 Points as Buyers Attempt a Recovery
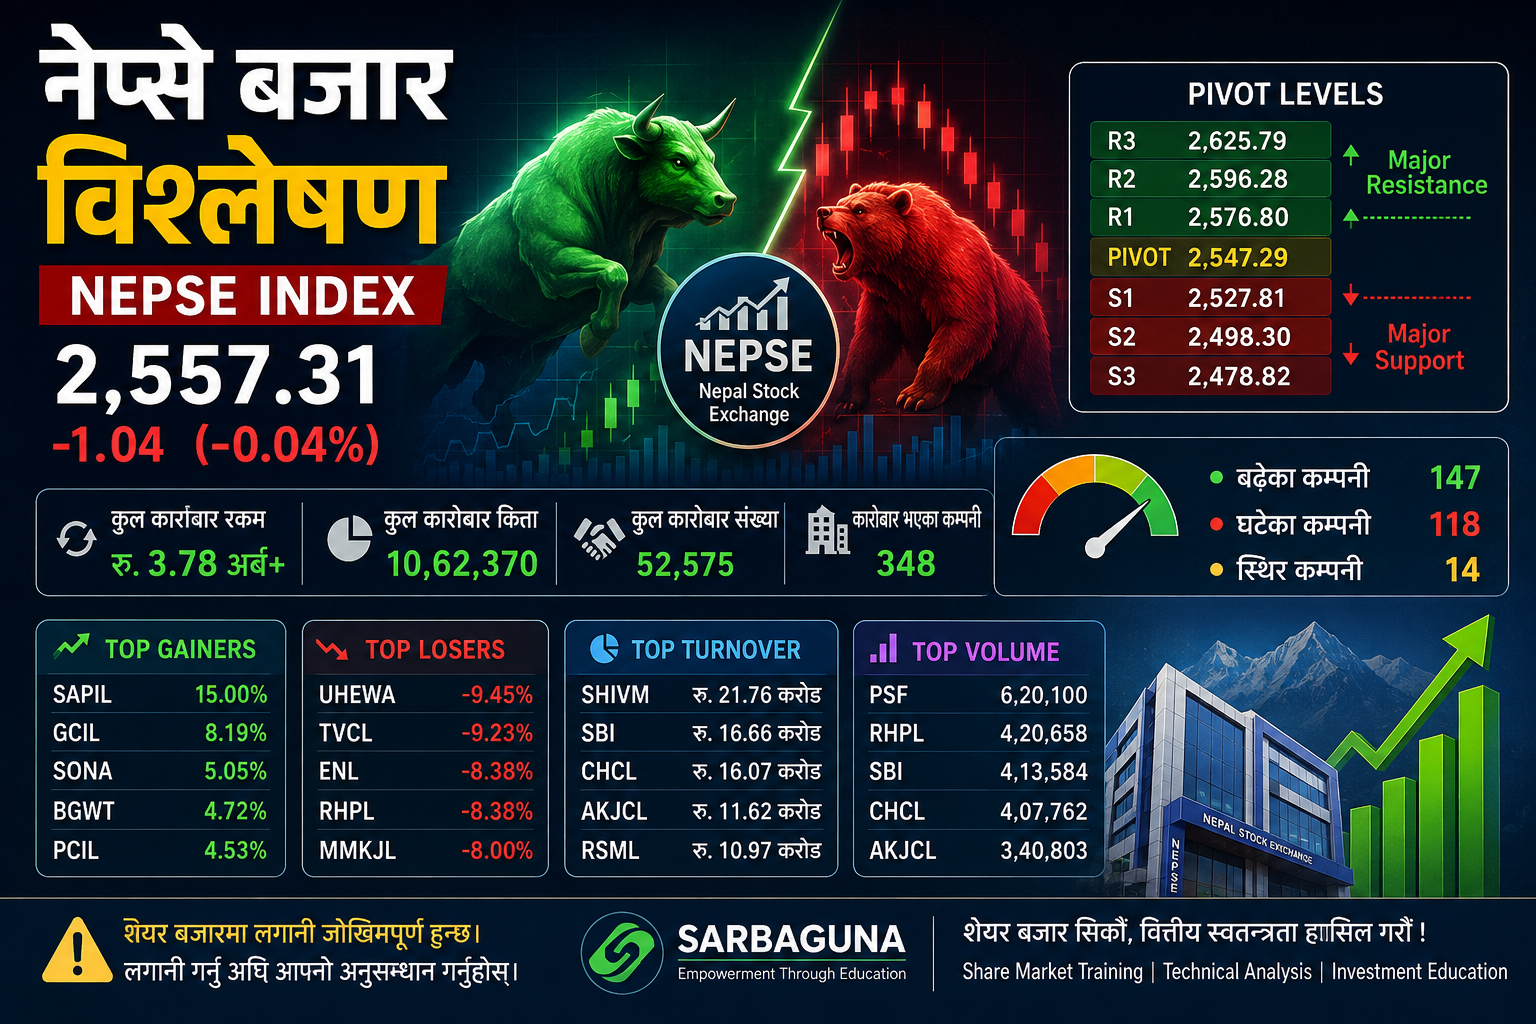
The Nepal Stock Exchange (NEPSE) showed a modest recovery last week, with the benchmark index gaining 4.55 points to close at 2,591.80. Although the market recorded a slight weekly increase, weak trading volume and the index's position below key moving averages suggest that investors should remain cautious.
The market is showing early signs of buying interest near a support zone. However, a stronger recovery will require confirmation from price action, trading volume, and technical indicators.
For investors following the NEPSE index, share market Nepal, and stock market trading opportunities, the coming trading sessions will be important in determining whether the recent rebound can develop into a sustainable upward move.
NEPSE Weekly Market Performance
During the previous week, NEPSE closed at 2,587.25 points. It subsequently advanced by 4.55 points, equivalent to approximately 0.18%, to finish at 2,591.80 points.
The market was open for five trading sessions. Three sessions ended positively, while two recorded declines.
| Market Indicator | Weekly Observation |
|---|---|
| Previous closing index | 2,587.25 |
| Latest closing index | 2,591.80 |
| Weekly change | +4.55 points |
| Percentage change | +0.18% |
| Positive sessions | 3 |
| Negative sessions | 2 |
| Trading volume | Below the 20-day average throughout the week |
The modest gain indicates that selling pressure may be easing. Nevertheless, the relatively small increase does not yet establish a confirmed bullish trend.
1. Buyers Show Interest Near Support
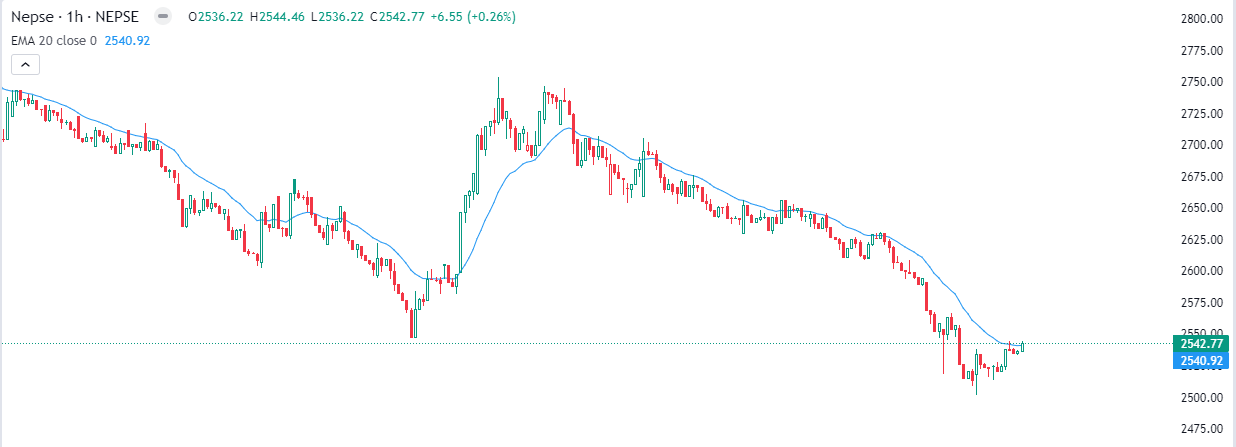
NEPSE appears to be attempting a rebound from a technical support area. The green candlestick formed during the final trading session suggests that buyers became more active after the market approached lower price levels.
This development may indicate that some investors are willing to accumulate shares at relatively lower prices. However, one positive candlestick alone is insufficient to confirm a trend reversal.
Investors should monitor the following signals:
- Bullish confirmation: A sustained move above nearby resistance with improving volume.
- Support confirmation: The index holds its recent support area during subsequent sessions.
- Potential weakness: The index falls below support and selling pressure increases.
- Stronger recovery: The index moves above short-term moving averages and continues to make higher highs and higher lows.
A disciplined approach to technical analysis can help investors distinguish a genuine recovery from a temporary market bounce.
2. NEPSE Remains Below Key Moving Averages
The index has approached its 10-day moving average but remains slightly below it. This is an important short-term technical level because moving averages can help traders identify changes in market momentum.
A breakout above the 10-day moving average could provide an initial positive signal. However, the 25-day, 50-day, and 100-day moving averages remain important resistance areas to monitor.
What Should Investors Watch?
10-day moving average: A close above this level could indicate improving short-term momentum.
25-day moving average: A potential resistance level that may test the strength of the recovery.
50-day moving average: A useful indicator for assessing whether the market is regaining medium-term strength.
100-day moving average: A broader trend reference that can help investors evaluate the market's longer-term direction.
Moving averages should not be interpreted in isolation. Price action, volume, support and resistance, and other indicators should be considered together before making trading decisions.
3. Trading Volume Remains a Major Concern
Despite the slight rise in the NEPSE index, daily trading volume remained below its 20-day average throughout the week.
Low volume can weaken the reliability of a price recovery because it suggests that the upward movement has not yet attracted sufficiently strong market participation.
There was some improvement in volume toward the end of the week compared with the beginning. This may indicate that market participation is gradually improving, but further confirmation is necessary.
For investors learning technical analysis through a Share Class Nepal program, volume analysis is an important skill. It helps traders evaluate whether a breakout is supported by meaningful buying activity or is occurring in a relatively weak market.
A potential bullish breakout accompanied by rising volume generally deserves more attention than a similar move on declining volume.
4. MACD Indicates Weakening Bearish Momentum
The Moving Average Convergence Divergence (MACD) indicator showed signs of easing bearish momentum during the week.
The gap between the MACD line and the signal line narrowed, while the negative histogram became smaller.
These developments suggest that downward momentum may be losing strength. They can also indicate that the market is approaching a possible bullish momentum shift.
However, a reduction in negative momentum does not automatically mean that an upward trend has started.
Investors should look for additional confirmation, including:
- A bullish MACD crossover.
- An improving histogram that continues to move toward the positive zone.
- A breakout above nearby resistance.
- Increasing trading volume during upward movements.
When these signals align with the price chart, the possibility of a stronger recovery may become more credible.
5. Stochastic RSI Shows a More Balanced Market
The Stochastic RSI remained in the neutral zone during the reporting period, indicating a relatively balanced relationship between buying and selling pressure.
Unlike a reading near the upper or lower extremes, a neutral reading does not independently establish whether the market is overbought or oversold.
Traders should observe whether the indicator moves upward alongside a price breakout or turns downward as the index approaches resistance.
Combining Stochastic RSI with MACD, moving averages, and volume can provide a more complete view of market momentum than relying on any single indicator.
NEPSE Market Outlook: What Could Happen Next?
The immediate outlook for NEPSE depends on whether the index can move above its short-term moving average and attract stronger trading volume.
Bullish Scenario
If the index breaks above its 10-day moving average and sustains the move with improving volume, short-term recovery momentum could strengthen. Further advances would need to overcome the 25-day, 50-day, and 100-day moving averages.
Sideways Scenario
If buying and selling pressure remain balanced, NEPSE could continue consolidating around its recent closing level. In this situation, investors should avoid assuming that a small upward movement guarantees a new bullish trend.
Bearish Scenario
If the index fails to maintain its nearby support area and selling pressure increases, the recent recovery attempt could weaken. A decline below support would require investors to reassess their risk exposure and trading plans.
These are conditional scenarios rather than guaranteed market predictions. Exact support and resistance levels should be calculated using the latest NEPSE price data and updated technical charts.
What Should NEPSE Investors Do This Week?
Investors should prioritize confirmation, risk management, and stock-specific analysis rather than making decisions based solely on a small rise in the benchmark index.
- Monitor the index: Watch whether NEPSE closes above its 10-day moving average.
- Confirm trading volume: Look for stronger participation during upward price movements.
- Study individual stocks: A rising index does not mean that every listed company will gain.
- Identify support and resistance: Plan entry, stop-loss, and exit levels before placing trades.
- Review company fundamentals: Consider earnings, book value, debt, cash flow, and valuation.
- Avoid emotional decisions: Do not chase a stock simply because its price is rising rapidly.
Investors seeking structured learning can explore Share Market Training in Nepal and Professional Forex Trading Course in Nepal to develop their understanding of market analysis, trading strategies, and risk management.
Conclusion
NEPSE gained 4.55 points last week to close at 2,591.80, showing a modest recovery after recent market weakness. The final-session green candlestick, narrowing MACD gap, and smaller negative histogram suggest that bearish momentum may be easing.
However, trading volume remained below the 20-day average, and the index was still below its 10-day moving average. These factors mean that a sustained bullish reversal has not yet been confirmed.
The next direction of the Nepal share market will depend on the index's ability to break above short-term resistance, maintain support, and attract stronger buying participation.
For investors, the most practical strategy is to combine technical indicators with fundamental analysis, disciplined position sizing, and a clear risk-management plan.
Disclaimer: This article is for educational and informational purposes only. Stock market investments involve risk, and technical indicators cannot guarantee future performance. Investors should conduct their own research or consult a qualified financial professional before making investment decisions.
Frequently Asked Questions (FAQ)
1. What was the latest closing value of NEPSE in this weekly analysis?
NEPSE closed at 2,591.80 points, gaining 4.55 points or approximately 0.18% over the week.
2. Is NEPSE showing signs of recovery?
Yes, the green candlestick in the final session and weakening bearish momentum in MACD suggest a possible recovery attempt. However, a sustained bullish reversal requires confirmation from price action, moving averages, and trading volume.
3. Why is trading volume important in NEPSE analysis?
Trading volume helps investors evaluate the strength of a price movement. A breakout supported by rising volume is generally more convincing than a price increase accompanied by weak trading activity.
4. Which moving averages should NEPSE investors monitor?
Investors can monitor the 10-day, 25-day, 50-day, and 100-day moving averages to assess short-term momentum and potential resistance areas.
5. What does a narrowing MACD gap indicate?
A narrowing gap between the MACD and signal lines, along with a shrinking negative histogram, can indicate that bearish momentum is weakening. It does not independently confirm a bullish reversal.
6. How can beginners learn NEPSE technical analysis in Nepal?
Beginners can learn candlestick patterns, moving averages, MACD, RSI, volume analysis, support and resistance, and risk management through structured share market training in Nepal.
7. Should investors buy stocks when NEPSE starts rising?
Not automatically. Investors should evaluate individual company fundamentals, valuation, price trends, volume, risk tolerance, and entry and exit plans before buying shares.
8. Where can I get share market training in Nepal?
You can explore Sarbaguna's share market training resources or contact Deep Thapa by phone or WhatsApp at 9849290806 for information about available courses.
Learn Share Market Nepal with Sarbaguna
Sarbaguna provides educational resources for investors who want to understand the Nepal Stock Exchange (NEPSE), technical analysis, fundamental analysis, stock selection, and trading risk management. Whether you are a beginner or an experienced market participant, developing a structured investment process can help you make more informed decisions.
For information about Share Class Nepal, NEPSE technical analysis training, and stock market courses in Nepal, contact Deep Thapa by call or WhatsApp at 9849290806.
Related resources: Share Market Training Nepal | Invest in Undervalued Stocks Nepal | Professional Forex Trading Course Nepal
Tags


Leave a Comments
Comments

Popular






No comments yet.