


Support and Resistance in NEPSE: Share Class Nepal Guide
Support and Resistance in Stock Market: A Complete Guide for NEPSE Traders in Nepal
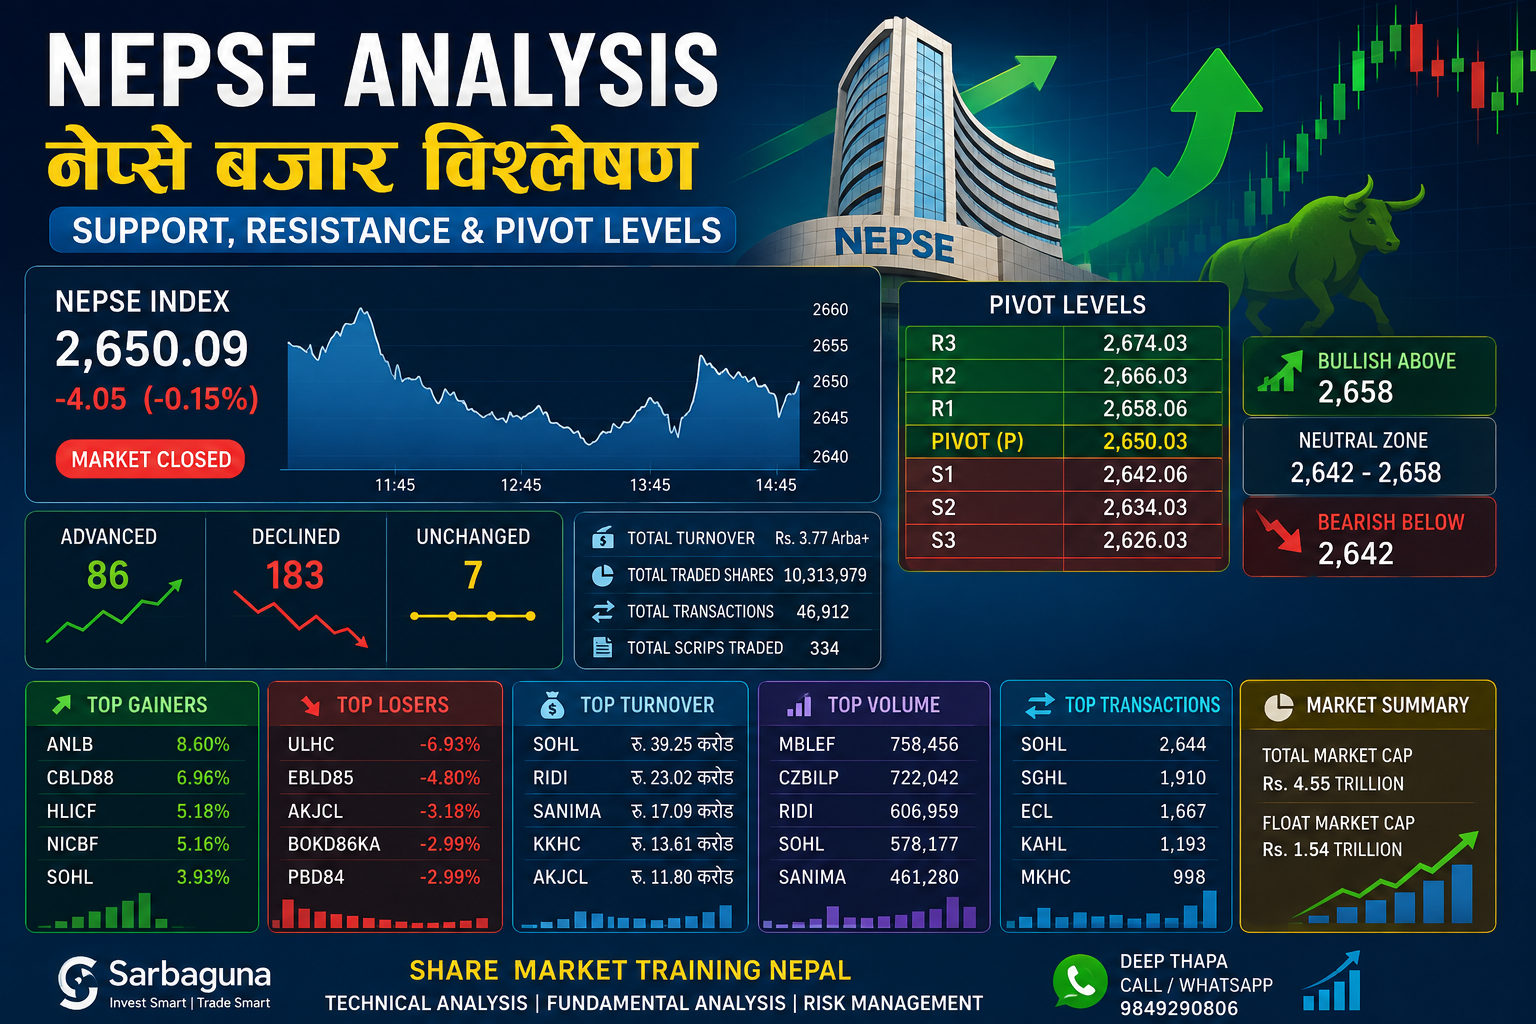
Support and resistance are the foundation of technical analysis and trend identification. Understanding these price levels helps stock market traders identify potential buying opportunities, selling zones, breakouts, reversals, and important risk-management levels.
For anyone learning the Nepal stock market, including beginners searching for a Share Class Nepal or professional stock market training, support and resistance are essential concepts to master.
What Is Support in Stock Market Trading?
Support is a price level or zone where a falling market may stop declining or reverse upward. It represents an area where buying demand may become strong enough to slow down or overcome selling pressure.
In simple terms, support is often associated with the lowest point of a downward price movement, also known as a swing low.
Key Characteristics of Support
- Demand Zone: Support represents an area where buying interest may increase.
- Potential Buying Opportunity: Traders often monitor support zones for possible entry opportunities.
- Price Reversal: When buyers become stronger than sellers, the price may rebound from support.
- Trend Analysis: Support helps traders identify potential trend continuation or reversal points.
Professional traders may look for buying opportunities near support zones, but they generally assess price action, trading volume, market structure, and confirmation signals before entering a trade. Support does not guarantee that the price will rise.
What Is Resistance in Stock Market Trading?
Resistance is a price level or zone where a rising market may struggle to move higher or reverse downward. It represents an area where selling pressure may become strong enough to slow or stop an upward price movement.
In simple terms, resistance is often associated with the highest point of an upward price movement, also known as a swing high.
Key Characteristics of Resistance
- Supply Zone: Resistance represents an area where selling interest may increase.
- Potential Selling Opportunity: Traders may monitor resistance for possible profit-booking or exit opportunities.
- Price Reversal: When selling pressure exceeds buying demand, the price may decline from resistance.
- Trend Analysis: Resistance helps traders identify potential obstacles to an ongoing uptrend.
Professional traders may consider selling or reducing positions near resistance, depending on their strategy and market conditions. However, resistance can also break, leading to further price increases.
Support vs. Resistance: What Is the Difference?
| Feature | Support | Resistance |
|---|---|---|
| Meaning | Potential floor for price | Potential ceiling for price |
| Typical location | Below the current market price | Above the current market price |
| Market zone | Demand zone | Supply zone |
| Associated price point | Swing low | Swing high |
| Common price reaction | Bounce or breakdown | Rejection or breakout |
| Trading consideration | Potential buying area | Potential selling or profit-booking area |
Why Are Support and Resistance Important for NEPSE Traders?
Support and resistance help traders understand how market participants react to historical price levels. These concepts are useful when analyzing individual NEPSE stocks, sector indices, and the overall NEPSE Index.
Traders can use these levels to:
- Identify potential entry and exit zones.
- Plan stop-loss levels and manage trading risk.
- Identify possible breakouts and breakdowns.
- Understand trend direction and market structure.
- Confirm trading setups using candlestick patterns and volume.
- Combine technical indicators with price action for a more complete analysis.
To improve your chart-reading skills, explore share market training in Nepal and learn how technical analysis can be applied to real market charts.
How to Identify Support and Resistance Levels
1. Study Previous Highs and Lows
Look for historical price points where the market repeatedly reversed or paused. Previous swing lows can help identify potential support, while previous swing highs can help identify potential resistance.
2. Mark Price Zones, Not Just Exact Lines
Support and resistance are better understood as zones rather than perfectly precise prices. A stock may reverse within a small price range instead of turning at one exact number.
3. Check Trading Volume
Volume can help traders assess the strength of a price reaction. A breakout supported by stronger trading activity may be more meaningful than a brief move above resistance on weak volume, although volume alone cannot confirm a breakout.
4. Use Candlestick Confirmation
Observe price behavior near important levels. Rejection candles, bullish or bearish engulfing patterns, and strong closing candles may provide additional evidence of buying or selling pressure.
5. Analyze Multiple Timeframes
Review daily, weekly, and shorter-term charts when appropriate. A support or resistance zone visible across multiple timeframes may be more significant than one appearing only on a very short-term chart.
For more advanced learning, study NEPSE technical analysis and trading education alongside support and resistance.
What Happens When Support or Resistance Breaks?
Support and resistance are not permanent barriers. Market prices can break through either zone when buying or selling pressure changes.
Support breakdown: If the price falls decisively below support, it may continue declining toward another support zone. The former support area may later act as resistance when the price attempts to recover.
Resistance breakout: If the price moves decisively above resistance, it may continue rising toward another resistance zone. The former resistance area may later act as support during a pullback.
Traders often watch for a candle close beyond the level, volume confirmation, and a possible retest before treating a breakout or breakdown as meaningful. False breakouts can occur, so risk management remains important.
Practical Example for NEPSE Share Trading
Suppose a NEPSE-listed stock repeatedly finds buying interest around Rs. 400 and struggles to move above Rs. 450.
- Support zone: Around Rs. 400, where previous declines have slowed.
- Resistance zone: Around Rs. 450, where previous upward movements have stalled.
- Possible bullish scenario: The price rebounds from support and moves toward resistance.
- Possible breakout scenario: The price closes above resistance with supportive market activity and later retests the breakout area.
- Possible bearish scenario: The price breaks below support and fails to recover, increasing the possibility of a further decline.
These figures are hypothetical and are intended only to explain the concept. They are not current NEPSE price levels or recommendations to buy or sell any security.
Learn Support and Resistance with Sarbaguna
Understanding support and resistance is an important step toward developing a disciplined approach to the stock market. By combining price action, chart patterns, trend analysis, volume, and risk management, traders can build a structured framework for analyzing NEPSE stocks.
If you want to improve your technical analysis skills, explore Sarbaguna Share Market Training Nepal for learning opportunities covering stock market basics, chart reading, technical indicators, and trading strategies.
For share market training and course information, contact Deep Thapa on WhatsApp: 9849290806.
Disclaimer: This article is for educational purposes only and does not constitute investment advice. Support and resistance levels are estimates, not guarantees of future price movements. Always assess risk and conduct your own research before making investment decisions.BAU


Leave a Comments
Comments


Popular






Recent Post

No comments yet.