
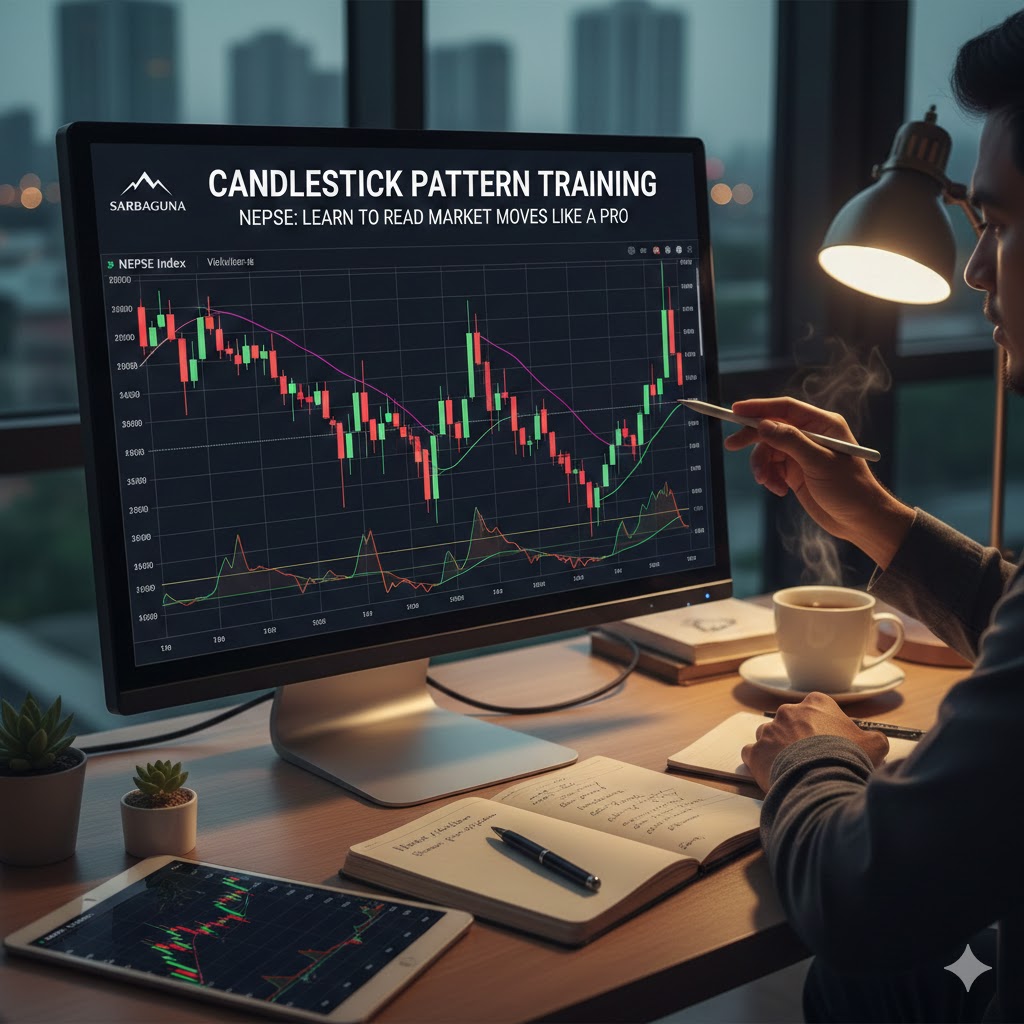
Candlestick Pattern Training NEPSE: Learn to Read Market Moves Like a Pro
Candlestick Pattern Training NEPSE: Learn How Nepali Traders Decode Market Moves
Candlestick patterns are one of the most powerful tools in technical analysis—and for NEPSE traders, they’re essential for interpreting price action and making informed decisions. In this Candlestick pattern training NEPSE guide, you’ll discover how these patterns reveal market sentiment, signal reversals, and help predict future movements on the Nepal Stock Exchange (NEPSE).
What Are Candlestick Patterns?
Candlestick charts plot a stock’s open, high, low, and close for each trading period, creating shapes traders use to understand market psychology. In this Candlestick pattern training NEPSE, you’ll learn how each candle tells a story of buyers and sellers battling for control—and how these stories can guide trading decisions instead of guessing market direction.
Key Bullish Signals Every NEPSE Trader Should Know
In this Candlestick pattern training NEPSE, beginners and experienced traders alike study these bullish patterns to spot potential uptrends:
- Hammer: A small body with a long lower wick that often signals a possible bottom after a price decline.
- Bullish Engulfing: A large green candle fully covering the previous red candle—suggesting strong buying pressure is emerging.
- Morning Star: A three-candle pattern that shifts sentiment from sell-side dominance to buy-side strength—often indicating a deeper trend reversal.
Bearish Patterns to Watch in NEPSE
Understanding bearish signals is equally important in Candlestick pattern training NEPSE:
- Shooting Star: Formed after an uptrend with a long upper wick—suggesting buyers are losing control.
- Bearish Engulfing: A big red candle that swallows a preceding green candle—indicating sellers have taken over.
- Evening Star: The opposite of a morning star and a classic trend reversal pattern.
Neutral Patterns and Market Indecision
Some candlesticks don’t clearly signal buy or sell pressure. The Doji, for example, appears when open and close are almost equal—suggesting hesitation. Recognizing indecision is crucial in Candlestick pattern training NEPSE, especially before big news events or policy decisions that can shake market sentiment.
Combining Patterns with Volume and Indicators
Candlestick signals become more reliable when used alongside volume confirmation and other technical tools such as RSI, MACD, and moving averages. Volume helps confirm whether a pattern reflects genuine market interest or just a weak move that may not sustain.
Real NEPSE Examples
During a rebound in NABIL Bank’s share price, a hammer pattern near support marked the start of a price bounce. Similarly, during rallies in hydropower stocks like CHCL and NGPL, multiple bullish engulfing patterns confirmed strong buying interest—helping traders act with confidence.
Avoiding Common Pitfalls
A critical part of Candlestick pattern training NEPSE is learning what not to trade:
- Avoid acting on single-candle signals without subsequent confirmation.
- Be cautious with patterns formed on low volume—they often fail.
- Always check the broader trend: a bearish signal in a strong uptrend might be a temporary pause, not a reversal.
Conclusion: Why Candlestick Pattern Training NEPSE Matters
In NEPSE’s dynamic environment, understanding candlestick patterns bridges the gap between raw price charts and actionable market insight. Whether you’re just starting out or refining your strategy, mastering these patterns enhances your ability to read charts with clarity, reduce emotional trading, and make decisions rooted in data.
Candlestick pattern training NEPSE
📞 Contact: Deep Thapa
📱 Mobile: 9849290806
Tags


Leave a Comments
Comments


Popular


No comments yet.