

SAHAS Share Price Analysis: Support, Resistance and Technical Outlook
SAHAS Share Price Analysis: Can Sahas Urja Continue Its Uptrend?
Sahas Urja Limited (SAHAS) has remained one of the actively watched stocks in the Nepalese stock market, with its price showing a strong upward movement over the past several months. The latest daily candlestick chart indicates that SAHAS share price has reached the Rs. 700 zone after climbing steadily from the Rs. 540–560 area.
At the latest session, SAHAS closed at Rs. 695, down Rs. 14 or 1.97%. The stock traded between an intraday high of Rs. 714.70 and a low of Rs. 690.50, while total volume stood at around 162.25K shares.
SAHAS Share Price Trend
The daily chart shows that Sahas Urja has maintained a broadly bullish structure since the beginning of the year.
The stock initially traded around the Rs. 540–570 zone before gradually gaining momentum. A significant breakout was observed around March, when SAHAS moved above the Rs. 600 level. The stock subsequently consolidated before another strong upward move took it toward Rs. 680–720.
From a technical-analysis perspective, the sequence of higher highs and higher lows suggests that the medium-term trend remains positive.
Recent Price Action
SAHAS recently moved above the Rs. 680–690 area and tested the Rs. 714.70 level. However, the latest session witnessed selling pressure near the higher levels, resulting in a close at Rs. 695.
The formation of a bearish daily candle after testing above Rs. 710 indicates that traders should closely monitor the Rs. 690–700 zone in the coming sessions.
A successful hold above this area could keep the bullish momentum intact, while a decisive breakdown may trigger short-term profit booking.
SAHAS Technical Analysis: Key Support and Resistance
Based on the visible daily chart, the important technical levels for SAHAS can be broadly observed as follows:
Immediate Resistance:
- Rs. 710–715
- Rs. 720
Major Resistance:
- Rs. 730 and above, if Rs. 720 is decisively breached
Immediate Support:
- Rs. 690
- Rs. 680
Major Support:
- Rs. 660–665
- Rs. 640–650
The Rs. 700 psychological level is also important. Sustaining above Rs. 700 with strong volume could improve the probability of another attempt toward the recent high.
Volume Analysis
Volume is an important factor to watch in the SAHAS stock price analysis.
The latest session recorded approximately 162.25K shares in volume, indicating active participation. However, price movement near resistance should ideally be accompanied by strong buying volume for a sustainable breakout.
If SAHAS breaks above Rs. 715–720 with significantly higher volume, it could provide confirmation of renewed bullish momentum.
Conversely, increasing volume during a decline could indicate distribution or profit booking.
Bullish Scenario for SAHAS
If SAHAS successfully holds the Rs. 690–700 zone and breaks above the recent high around Rs. 715, the stock could enter another bullish phase.
A sustained breakout above Rs. 720 with strong volume would be technically significant. In such a scenario, traders may start watching higher resistance zones as the stock discovers new short-term price levels.
Bearish Scenario
On the downside, failure to sustain above Rs. 690 could increase short-term selling pressure.
A breakdown below Rs. 680 may weaken the immediate bullish structure and open the possibility of a move toward the Rs. 660–665 support zone.
A further breakdown below Rs. 660 could bring the Rs. 640–650 area into focus.
Therefore, traders should monitor both price and volume rather than relying solely on a single resistance or support level.
What Should SAHAS Investors Watch?
Investors and traders following Sahas Urja should focus on these factors:
- Rs. 700 psychological level
- Rs. 710–715 resistance zone
- Rs. 720 breakout level
- Rs. 690 immediate support
- Rs. 680 short-term trend support
- Trading volume during breakout or breakdown
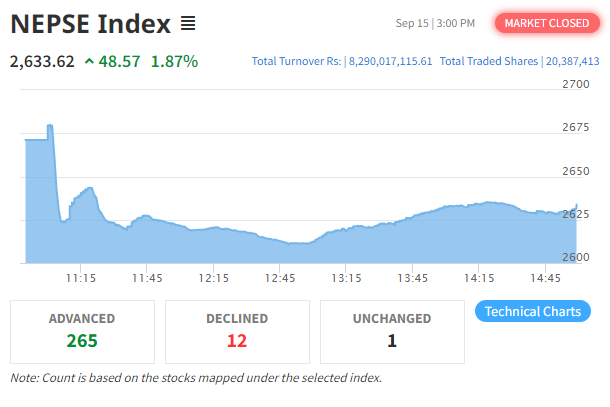
- Overall NEPSE market sentiment
The stock remains technically interesting, but the recent rejection from above Rs. 710 suggests that profit booking cannot be ignored.
SAHAS Share Price Outlook
Overall, the SAHAS technical chart continues to show a positive medium-term structure. The stock has moved significantly higher from its earlier trading range and is now testing an important psychological and technical zone around Rs. 700–720.
For bullish continuation, SAHAS needs to sustain above its immediate support levels and ideally break the Rs. 715–720 resistance zone with strong volume.
Traders should also remain cautious about chasing the price after a sharp rally and should consider risk management, support levels and market conditions before making investment decisions.
Sarbaguna View: SAHAS remains a stock worth watching as it approaches the Rs. 720 resistance zone. A high-volume breakout could strengthen the bullish outlook, while weakness below Rs. 680 could signal short-term correction.
Note: This article is based on technical price-chart analysis and is intended for educational and informational purposes only. It is not a recommendation to buy or sell SAHAS shares.


Leave a Comments
Comments


Popular






Recent Post
No comments yet.