

FM Swarnim Wagle’s Capital Market Action Plan Ignites Market as NEPSE Up 48.57 Points
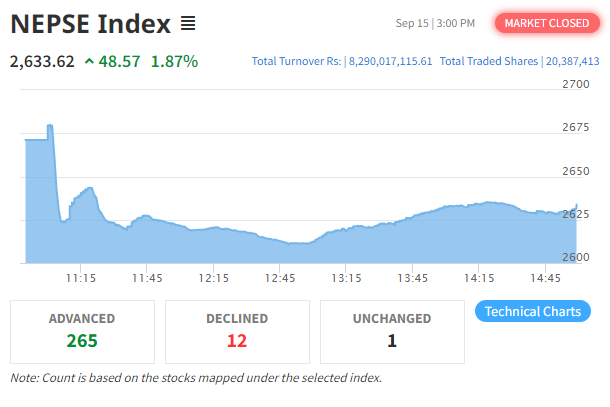
The benchmark Nepal Stock Exchange (NEPSE) index demonstrated strong upward momentum, gaining 48.57 points (+1.87%) to finish at 2,633.62. Market liquidity expanded significantly, with trading volume effectively doubling to top NPR 8.291 + Arba across 20,387,413 traded shares.
Broad-based buying pressure across key sectors underpinned the rally, signaling robust investor confidence and heightened market participation throughout the trading day.
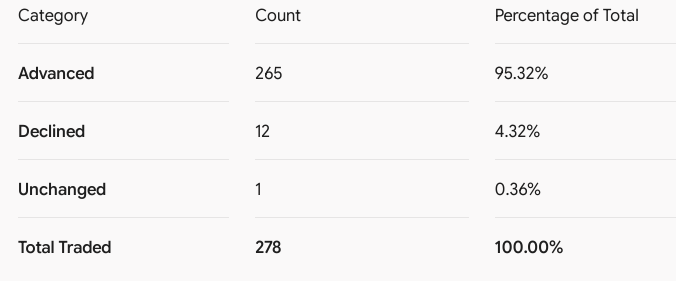
Market Breadth
Top Gainers Analysis
Top Losers Analysis
| Symbol | Company / Instrument Name | Sector | Close Price (NPR) | Pt. Change | % Change |
| EBLD86 | 8.5% Everest Bank Limited Debenture 2086 | Corporate Debenture | 1,090.00 | -64.00 | -5.55% |
| KBLD90 | 10% KBL Debenture 2090 | Corporate Debenture | 1,301.60 | -40.20 | -3.00% |
| BNL | Bottlers Nepal (Balaju) Limited | Manufacturing & Processing | 13,515.00 | -414.20 | -2.97% |
| SBID83 | 10.25% Nepal SBI Bank Debenture 2083 | Corporate Debenture | 1,030.10 | -29.90 | -2.82% |
| RSML | Reliance Spinning Mills Limited | Manufacturing & Processing | 2,879.00 | -57.00 | -1.94% |
Top Turnover Analysis
| Symbol | Company Name | Sector | Turnover (NPR) | Last Traded Price (LTP) |
| RSML | Reliance Spinning Mills Limited | Manufacturing & Processing | 327,007,876.40 | 2,879.00 |
| SHIVM | Shivam Cements Limited | Manufacturing & Processing | 315,697,044.30 | 681.00 |
| API | Api Power Company Limited | Hydropower | 284,415,814.00 | 343.90 |
| NRN | NRN Infrastructure and Development Ltd. | Investment | 282,950,618.80 | 1,468.00 |
| LEC | Liberty Energy Company Limited | Hydropower | 273,332,785.20 | 256.80 |
-
Concentrated Capital Flow: The top five companies accounted for over NPR 1.48 Arba in total trading value during the session.
-
Sector Highlights: Manufacturing and Hydropower scripts drew heavy liquidity, with Reliance Spinning Mills (RSML) leading the market despite dropping into the top losers list, signaling significant profit-taking activity.
Sector-Wise Performance Analysis
Every sector sub-index closed in the green during the session, underscoring broad-based market participation and buying momentum across the exchange:
-
Top Sector Gainers: Insurance equities led percentage gains, with Non-Life Insurance (+2.82%) and Life Insurance (+2.59%) outperforming the broader market, followed by the Investment (+2.52%) and Finance (+2.23%) sectors.
-
Turnover Heavyweights: HydroPower generated the highest overall turnover at over NPR 3.63 Arba, followed by commercial Banking (NPR 1.17 Arba) and Manufacturing & Processing (NPR 1.11 Arba), showing strong institutional and retail liquidity flow into these core sectors.
Technical Outlook & Market Structure Analysis
Trend & Price Action
-
Candlestick Profile: The index printed a strong bullish continuous candle, opening near the session low of 2,610.45 and closing near the high at 2,633.62.
-
Immediate Resistance: The primary overhead supply zone lies at 2,650 – 2,680. A decisive daily close above this cluster targets the psychological barrier at 2,700.
-
Key Support Levels: Immediate support sits at 2,585 – 2,600 (previous breakout pivot), followed by secondary major support at 2,525 – 2,550.
Volume & Liquidity Metrics
-
Volume Expansion: Total turnover expanded to NPR 8.291 Arba, effectively doubling the prior session’s liquidity. The high volume accompanying a +1.87% index move confirms genuine institutional demand rather than low-volume retail churn.
-
Volume Concentration: Hydropower (NPR 3.63 Arba), Banking (NPR 1.17 Arba), and Manufacturing (NPR 1.12 Arba) together absorbed over 71% of total market turnover, establishing these sectors as current market leaders.
Momentum & Oscillators
-
Relative Strength Index (RSI): The daily RSI shifted firmly into upper-bullish territory (62–65 zone), indicating accelerating upward momentum without entering extreme overbought levels (>70).
-
Moving Average Convergence Divergence (MACD): The MACD histogram expanded positively above the zero line, signaling strengthening trend velocity and a continuation of the short-term bullish crossover.
Tags


Leave a Comments
Comments
Related post

Popular






Recent Post
No comments yet.