

Decoding the Bollinger Band: The Volatility Rubber Band Every Trader Should Know
If you have ever looked at a stock chart, you have likely seen a chaotic line bouncing up and down like a electrocardiogram. For beginners, trying to figure out when to buy or sell can feel like guessing.
Enter the Bollinger Band—one of the most popular and intuitive technical analysis tools used by traders worldwide. Created by famous financial analyst John Bollinger in the 1980s, this indicator acts like a dynamic "rubber band" for price action, helping investors spot whether an asset is overbought, oversold, or ready for an explosive breakout.
Here is your beginner-friendly guide to understanding how Bollinger Bands work and how to read them.
What Is a Bollinger Band?
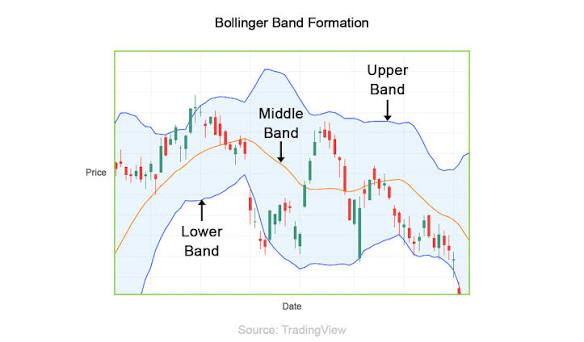
At its core, a Bollinger Band consists of three lines overlaid directly onto a price chart. Together, they create a visual envelope around price movements.
+---------------------------------------------------+  < Upper Band (Resistance / Overbought)
|       . - * - .                                   |
|     /           \        . - * - .                |
| - - - - - - - - - \ - -/ - - - - - \ - - - - - - - |  < Middle Band (20-Day SMA / Baseline)
|                     *               \           / |
|                                       ` - * - '   |  < Lower Band (Support / Oversold)
+---------------------------------------------------+
The 3 Core Components
-
The Middle Band (The Baseline):
This is simply a 20-period Simple Moving Average (SMA). It calculates the average closing price over the last 20 periods (usually 20 days on a daily chart) and serves as the trend's anchor.
-
The Upper Band (The High Barrier):
Calculated by taking the Middle Band and adding 2 standard deviations. Statistically, this represents an unusually high price level.
-
The Lower Band (The Low Barrier):
Calculated by taking the Middle Band and subtracting 2 standard deviations. This represents an unusually low price level.
The Statistical Secret: Because standard deviation measures volatility, roughly 95% of all price action naturally stays inside these upper and lower boundaries. When prices touch or break out of the bands, something significant is happening.
How to Read Bollinger Bands: 3 Classic Patterns
1. The "Rubber Band" Effect (Overbought vs. Oversold)
Think of the bands like a stretched rubber band. When stretched too far in one direction, prices tend to snap back toward the middle.
-
Price touches the Upper Band: The asset may be overbought (overextended). It does not guarantee an immediate drop, but it warns that the rally is getting stretched.
-
Price touches the Lower Band: The asset may be oversold (undervalued). It suggests selling pressure might be running out of steam.
2. The Bollinger "Squeeze" (The Volatility Explosion)
Volatility in financial markets comes in cycles—quiet periods lead to explosive moves, and explosive moves lead back to quiet consolidation.
-
When the bands contract (get narrow): This is called a Squeeze. It signals that volatility has dropped to extreme lows.
-
The Trading Cue: A tight squeeze is like compressing a spring. Traders watch closely for a sudden breakout above or below the bands, which often signals the start of a major new trend.
3. The Band Walk (Strong Trends)
A common beginner mistake is assuming that touching the upper band means "sell immediately." During a powerful bull run, prices can continuously "walk up" the upper band for days or weeks at a time.
-
Riding the Wave: If prices hug the upper band while the bands expand outward, the trend strength is exceptionally high.
Comparison: Bollinger Bands vs. Other Indicators
| Indicator | Primary Focus | Best Used For | Key Advantage |
| Bollinger Bands | Volatility & Range | Identifying squeezes, overbought/oversold levels | Adjusts dynamically to market conditions |
| Relative Strength Index (RSI) | Momentum (0–100 scale) | Measuring speed and change of price moves | Great for divergence signals |
| Moving Averages (SMA/EMA) | Directional Trend | Identifying overall market direction | Smooths out noise over long periods |
Golden Rules for Beginners
-
Never Trade in Isolation: Bollinger Bands show volatility and relative price levels, not absolute buy/sell signals. Always confirm band touches with momentum indicators (like RSI or MACD) or volume patterns.
-
Standard Settings Work Best: Default parameters (20-period SMA, 2 standard deviations) are industry standards. Stick with these while learning.
-
Respect the Trend: In strong uptrends, prices will frequently hit the upper band without falling. Avoid shorting a stock just because it touches the top band!
Tags


Leave a Comments
Comments


Popular






Recent Post

No comments yet.