

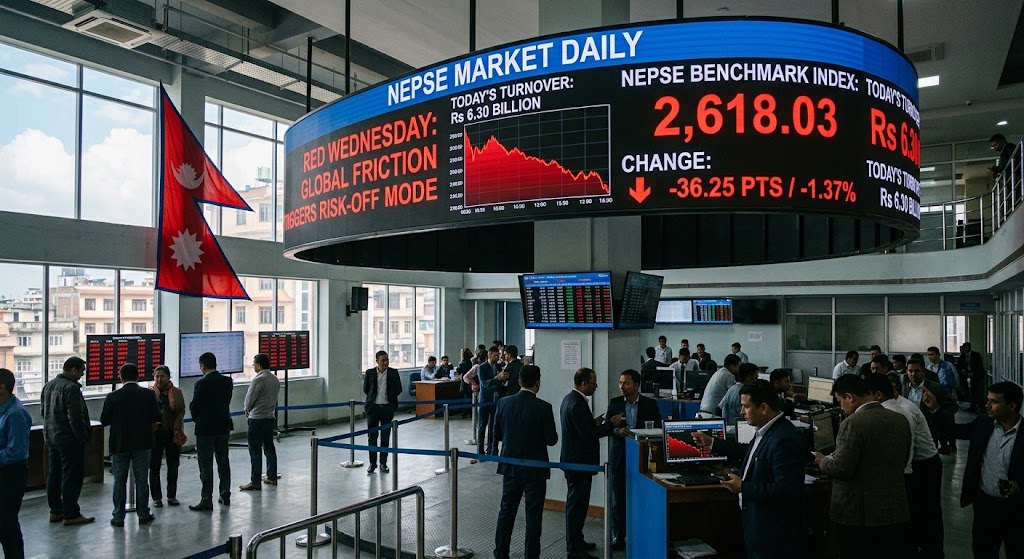
Global Friction Signals Risk-Off Mode in NEPSE as Red Wednesday to 2618
The Nepal Stock Exchange (NEPSE) experienced a steep decline today, as the benchmark index dropped 36.25 points to close at 2,618.03. Escalating geopolitical friction in the West sparked widespread risk-aversion among domestic investors, triggering aggressive sell-offs across major sectors. Market liquidity remained heavy despite the downturn, with daily turnover crossing Rs 6.30 billion as 21,622,728 shares changed hands across the floor.
Market Breadth
- Advanced 23
- Declined 253
- Unchanged 2
Interpretation:
- ADR : 0.091 (Driven by widespread selling across the board)
- For every 1 stock that advanced, roughly 11 stocks declined (1:11 ratio)
Top Gainers
| Symbol | Turnover | LTP | Pt. Change | % Change |
| DLBS | 4,002,684.70 | 1,341.90 | 175 | 15 |
| CYCL | 16,854,638.60 | 1,531.00 | 79 | 5.44 |
| NIFRAGED | 838,712.00 | 1,082.00 | 51.9 | 5.04 |
| PBD84 | 69,450.00 | 1,080.00 | 39.9 | 3.84 |
| GBIMESY2 | 16,541.00 | 9.26 | 0.33 | 3.7 |
Top Losers
| Symbol | Turnover | Close Price | Pt. Change | % Change |
| FMDBL | 22,668,526.60 | 750.00 | -70.00 | -8.54 |
| MEPDL | 21,670,419.80 | 646.20 | -39.20 | -5.72 |
| KMCDB | 2,370,022.30 | 810.00 | -45.00 | -5.26 |
| IHL | 3,235,989.30 | 325.10 | -17.90 | -5.22 |
| EBLD85 | 3,309.00 | 1,103.00 | -57 | -4.91 |
Top Turnover Stocks
| Symbol | Qty | Turnover (NPR) | LTP | Point Change | % Change | Market Weighted |
| SHIVM | 555,271 | 383,446,856.30 | 687.00 | +2.90 | +0.42% | 6.03% |
| RSML | 78,342 | 212,561,553.50 | 2,722.90 | +23.90 | +0.89% | 3.34% |
| HDL | 160,407 | 205,417,048.70 | 1,278.30 | -5.70 | -0.44% | 3.23% |
| LSL | 761,653 | 188,492,268.60 | 245.90 | -4.10 | -1.64% | 2.97% |
| AKJCL | 479,494 | 172,978,748.20 | 358.00 | -6.80 | -1.86% | 2.72% |
-
Extreme Capital Concentration: These top 5 scrips alone represent 18.29% of total market turnover (6.03% + 3.34% + 3.23% + 2.97% + 2.72%). Nearly 1 in every 5 Rupees traded across the entire floor today flowed into just these five companies.
-
Defensive Outperformance in Manufacturing: Both SHIVM (6.03% market weight) and RSML (3.34% market weight) absorbed the heaviest volume while maintaining positive territory (+0.42% and +0.89%). Strong institutional buying in these non-banking/manufacturing names served as a defensive buffer during the session.
-
Liquidity-Driven Exit in Mid-Caps: Highly liquid stocks like LSL (-1.64%) and AKJCL (-1.86%) experienced heavy selling pressure, showing that traders utilized active trading volume to offload risk assets amidst the wider 36.25-point market drop.
Sector Wise
| Sub Index | Advanced | Declined | Unchanged | Close | Point | % Change | Turnover (NPR) | Market Remarks / Technical Outlook |
| Banking | 0 | 19 | 0 | 1,497.87 | -18.59 | -1.22% | 884,549,510.20 |
Complete capitulation across commercial banks; absorbed heavy institutional selling without a single advance. |
| Development Bank | 0 | 16 | 0 | 5,443.83 | -75.49 | -1.36% | 432,102,229.70 |
Broad-based decline reflecting systemic risk aversion across regional lender scripts. |
| Finance | 2 | 11 | 1 | 2,230.87 | -24.76 | -1.09% | 103,091,926.60 |
High-beta volatility moderated by minor speculative buys in 2 scripts despite market pressure. |
| Hotels And Tourism | 1 | 7 | 0 | 7,161.86 | -70.90 | -0.98% | 119,736,947.71 |
Weak tourist inflow expectations and global risk sentiment weighed on hospitality stocks. |
| HydroPower | 9 | 102 | 0 | 3,598.63 | -60.99 | -1.66% | 2,703,107,025.40 |
Primary epicenter of volume; mass liquidation driven by retail panic and potential margin calls. |
| Investment | 1 | 6 | 0 | 96.54 | -1.46 | -1.49% | 367,278,141.50 |
Moderate sell-off tracking broader index weakness as holding companies adjusted downward. |
| Life Insurance | 0 | 14 | 0 | 11,800.79 | -246.65 | -2.04% | 153,927,509.10 |
Top percentage loser of the day; experienced sharp profit-booking and distribution. |
| Manufacturing & Processing | 3 | 12 | 1 | 10,638.15 | -48.19 | -0.45% | 1,006,166,937.20 |
Outperformed the broader index; strong institutional buffer from SHIVM and RSML. |
| Microfinance | 7 | 42 | 0 | 4,530.62 | -60.33 | -1.31% | 227,808,107.80 |
Selective buying in select microfinances couldn't halt the wider sub-index decline. |
| Mutual Fund | 14 | 24 | 3 | 19.58 | -0.03 | -0.15% | 55,279,295.97 |
Lowest volatility sub-index; traded near NAV floors with balanced, low-volume activity. |
| Non Life Insurance | 0 | 13 | 0 | 9,666.00 | -129.78 | -1.32% | 41,153,196.60 |
Unanimous decline; zero advancing scrips on low liquidity indicating lack of buyer support. |
| Others | 0 | 9 | 0 | 1,829.74 | -30.88 | -1.65% | 87,074,308.05 |
Heavily impacted by heavyweights like NTC following global market risk trends. |
| Trading | 0 | 2 | 0 | 3,238.56 | -41.40 | -1.26% | 39,571,667.40 |
Thin trading volume with immediate price markdowns across all constituents. |
Key Summary
-
Defensive Sector: Manufacturing & Processing (-0.45%) showed significant institutional absorption.
-
Highest Pressure: Life Insurance (-2.04%) and Hydro Power (-1.66%) bore the brunt of market-wide liquidations.
-
Liquidity Driver: Hydro Power alone absorbed over 42% of total daily turnover (NPR 2.70 Billion).
NEPSE Technical Breakdown
1. Key Price Levels & Structure
-
Current Close: 2,618.03 (-36.25 points / -1.37%)
-
Daily Range: High of 2,671.04 vs. Low of 2,613.13 (closed near the absolute low of the day).
-
Immediate Support (S1): 2,580 – 2,600 (psychological floor & previous demand zone).
-
Secondary Support (S2): 2,520 – 2,550 (major horizontal swing support).
-
Immediate Resistance (R1): 2,654 – 2,670 (previous close & today’s intraday high).
-
Major Resistance (R2): 2,720 – 2,750 (heavy supply zone).
For Educational Purpose Only _ Prepared by RICKY SINGH
Tags


Leave a Comments
Comments



Popular






Recent Post

No comments yet.