NEPSE Dips 13.85 Points to Close at 2531.55 as Selling Pressure Continued
- Sep 10, 2026
- 88
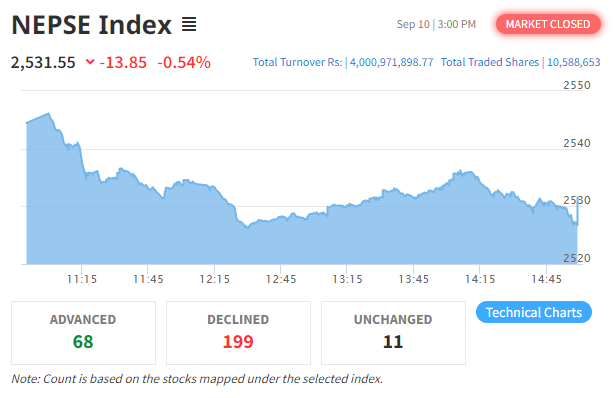
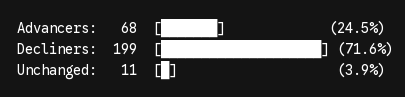
Nepal Stock Exchange (NEPSE) index registered a second consecutive session of decline on Thursday, shedding 13.85 points (-0.54%) to close at 2,531.55. Following the previous day's pullback, selling momentum continued across all major sector groups, dragging the benchmark index deeper into its current consolidation phase.
Market Breadth
Top Gainers
| Symbol | Company Name | Closing Price (LTP) | Change (Points) | % Change |
|---|---|---|---|---|
| LEC | Liberty Energy Company Limited | Rs. 246.10 | +32.10 | +15.00% |
| DOLTI | Dolti Power Company Limited | Rs. 299.00 | +22.70 | +8.22% |
| ULHC | Upper Lohore Khola Hydropower Co. | Rs. 320.00 | +21.00 | +7.02% |
| ENL | Emerging Nepal Limited | Rs. 620.00 | +32.10 | +5.46% |
| SSHL | Shiva Shree Hydropower Limited | Rs. 200.40 | +9.40 | +4.92% |
Top Losers
| Symbol | Company Name | Closing Price (LTP) | Change (Points) | % Change |
|---|---|---|---|---|
| SINDU | Sindhu Bikash Bank Limited | Rs. 359.70 | -63.40 | -14.98% |
| CORBL | Corporate Development Bank Limited | Rs. 814.00 | -45.00 | -5.24% |
| SPL | Shuvam Power Limited | Rs. 621.00 | -34.00 | -5.19% |
| DLBS | Dhaulagiri Laghubitta | Rs. 955.00 | -45.00 | -4.50% |
| BHPL | Barahi Hydropower Public Limited | Rs. 436.90 | -20.10 | -4.40% |
Top Turnover (Highest Volume Traded)
| Symbol | Company Name | Total Turnover (NPR) | Closing Price (LTP) |
|---|---|---|---|
| LEC | Liberty Energy Company Limited | Rs. 454,888,630.70 | Rs. 246.10 |
| RSML | Reliance Spinning Mills Limited | Rs. 211,267,268.20 | Rs. 2,910.00 |
| NRN | NRN Infrastructure & Development | Rs. 191,155,095.70 | Rs. 1,419.00 |
| SBI | Nepal SBI Bank Limited | Rs. 167,934,134.90 | Rs. 403.90 |
Sector-Wise Sub-Index Breakdown
| Sub-Index | Closing Level | Points Change | Percentage Change | Sector Tone |
|---|---|---|---|---|
| Manufacturing & Processing | 10,458.45 | -121.00 | -1.14% | Steepest Loss |
| Non-Life Insurance | 9,262.31 | -73.31 | -0.78% | Weak |
| Finance | 2,183.58 | -14.71 | -0.67% | Moderate Decline |
| Others | 1,783.59 | -11.60 | -0.65% | Moderate Decline |
| Microfinance | 4,391.68 | -25.03 | -0.57% | Moderate Decline |
| Mutual Fund | 19.48 | -0.11 | -0.56% | Mild Drag |
| Hydropower | 3,477.88 | -19.48 | -0.56% | Mild Drag |
| Hotels & Tourism | 6,952.45 | -35.32 | -0.51% | Mild Drag |
| Commercial Banking | 1,437.96 | -6.93 | -0.48% | Low Volatility |
| Investment | 93.90 | -0.37 | -0.39% | Low Volatility |
| Development Bank | 5,294.63 | -18.21 | -0.34% | Minor Loss |
| Trading | 3,179.06 | -8.82 | -0.28% | Minor Loss |
| Life Insurance | 11,189.78 | -19.33 | -0.17% | Top Performer (Lowest Loss) |
Top 5 Stock Brokers by Turnover (Data Extracted)
| S.N. | Broker No. | Broker Name | Buy Amount (Rs.) | Sell Amount (Rs.) | Total Amount (Rs.) | Difference (Rs.) | Matching Amount (Rs.) |
|---|---|---|---|---|---|---|---|
| 1 | 58 | Naasa Securities Co. Ltd. | 406,042,905.16 | 336,721,182.23 | 742,764,087.39 | +69,321,722.93 | 89,643,557.60 |
| 2 | 42 | Sani Securities Company Limited | 290,550,015.20 | 276,578,507.60 | 567,128,522.80 | +13,971,507.60 | 302,110,771.40 |
| 3 | 49 | Online Securities Limited | 115,790,454.50 | 177,128,740.40 | 292,919,194.90 | -61,338,285.90 | 10,829,759.20 |
| 4 | 44 | Dynamic Money Managers Securities Pvt. Ltd | 154,488,622.40 | 131,974,299.50 | 286,462,921.90 | +22,514,322.90 | 59,572,410.80 |
| 5 | 45 | Imperial Securities Co. Limited | 133,248,466.00 | 151,926,894.00 | 285,175,360.00 | -18,678,428.00 | 12,259,953.40 |
Key Takeaways from the Data
-
Market Dominance: The top 5 brokerages generated a combined turnover of NPR 2.17 Arba (Rs. 2,174,450,087.00).
-
Highest Turnover Leader: Naasa Securities (58) led overall floor activity with Rs. 74.27 Crore in turnover and stood as the largest net buyer (+Rs. 6.93 Crore).
-
Highest Matching Volume: Sani Securities (42) recorded the highest internal matching trade volume at Rs. 30.21 Crore.
-
Net Positions:
-
Net Buyers: Naasa Securities (58), Dynamic Money Managers (44), and Sani Securities (42).
-
Net Sellers: Online Securities (49) with -Rs. 6.13 Crore and Imperial Securities (45) with -Rs. 1.86 Crore.
-
Technical outlook
Intraday Price Action Movement
[2,545.40 Open] ──► [Morning Peak] ──► [Mid-day Steady Decline] ──► [2,531.55 Close]
-
Price Action & Candlestick Structure: The index opened near its previous session range but quickly encountered selling pressure . On the daily chart, today's price action formed a prior bearish Marubozu-style body with minimal lower wick, indicating that sellers maintained control straight through to the closing bell.
- Strategy: Swing traders should monitor how price reacts around the 2,500 – 2,520 zone. Confirmation of a bullish reversal pattern (such as a Hammer or Bullish Engulfing candle) accompanied by high volume is recommended before taking fresh long positions. Breakouts above 2,575 would be required to flip the short-term intraday trend back to positive.
Key Technical Support & Resistance Levels
| Type | Levels | Description & Market Significance |
|---|---|---|
| Immediate Resistance (R1) | 2,560 – 2,575 | Immediate overhead gap and previous intraday high zone. |
| Major Resistance (R2) | 2,595 – 2,600 | Aligned with the 20-day SMA and psychological round level. |
| Immediate Support (S1) | 2,520 – 2,530 | Current testing zone; minor swing reaction level from early September. |


No comments yet.