

NEPSE Technical Analysis: Doji Candles Signal Market Indecision at Bollinger Band Middle Line
NEPSE Technical Analysis: Doji Candles Signal Market Indecision at Bollinger Band Support
The Nepal Stock Exchange (NEPSE) is currently showing signs of market indecision as consecutive Doji candlesticks appear on the technical chart. At the same time, the index is attempting to maintain support around the Bollinger Band Middle Line, making the next few trading sessions important for determining the market's short-term direction.
The combination of Doji candles, Bollinger Band support and relatively strong trading volume suggests that buyers and sellers are currently competing closely for control.
Consecutive Doji Candles Show Market Indecision
A Doji candlestick generally forms when the opening and closing prices are close to each other. It indicates that neither buyers nor sellers were able to establish clear dominance during the trading session.
When two or three Doji candles appear consecutively, it can indicate a period of consolidation and uncertainty.
For NEPSE traders, this means the market may be preparing for a stronger move, but the direction still requires confirmation from subsequent price action.
A Doji by itself does not necessarily indicate a bullish or bearish reversal. The surrounding trend, support and resistance levels, volume and the following candles should also be considered.
Bollinger Band Middle Line Remains Important Support
One of the key technical observations is that NEPSE is attempting to hold above the Bollinger Band Middle Line, which commonly represents the 20-period moving average.
Holding this level can indicate that the prevailing short-term trend is still receiving support.
If NEPSE continues to trade above the Middle Band and buyers appear with stronger momentum, the index could attempt another upward move toward higher resistance levels.
However, a decisive breakdown below the Middle Band could increase the possibility of short-term weakness or further consolidation.
Why the Next Trading Session Matters
The Doji formation needs confirmation from the next price movement.
Bullish Confirmation
If NEPSE produces a strong bullish candle and moves higher from the Middle Band support, it could indicate that buyers are regaining control.
A sustained move above the recent trading range, particularly when supported by increasing volume, would provide stronger confirmation of bullish momentum.
Bearish Confirmation
On the other hand, if NEPSE forms a strong bearish candle and closes below the Bollinger Band Middle Line, traders may need to watch for a potential short-term correction.
A breakdown accompanied by increased selling volume would provide stronger evidence that the support level has weakened.
NEPSE Trading Volume Remains Significant
Trading volume is another important factor in interpreting the current setup.
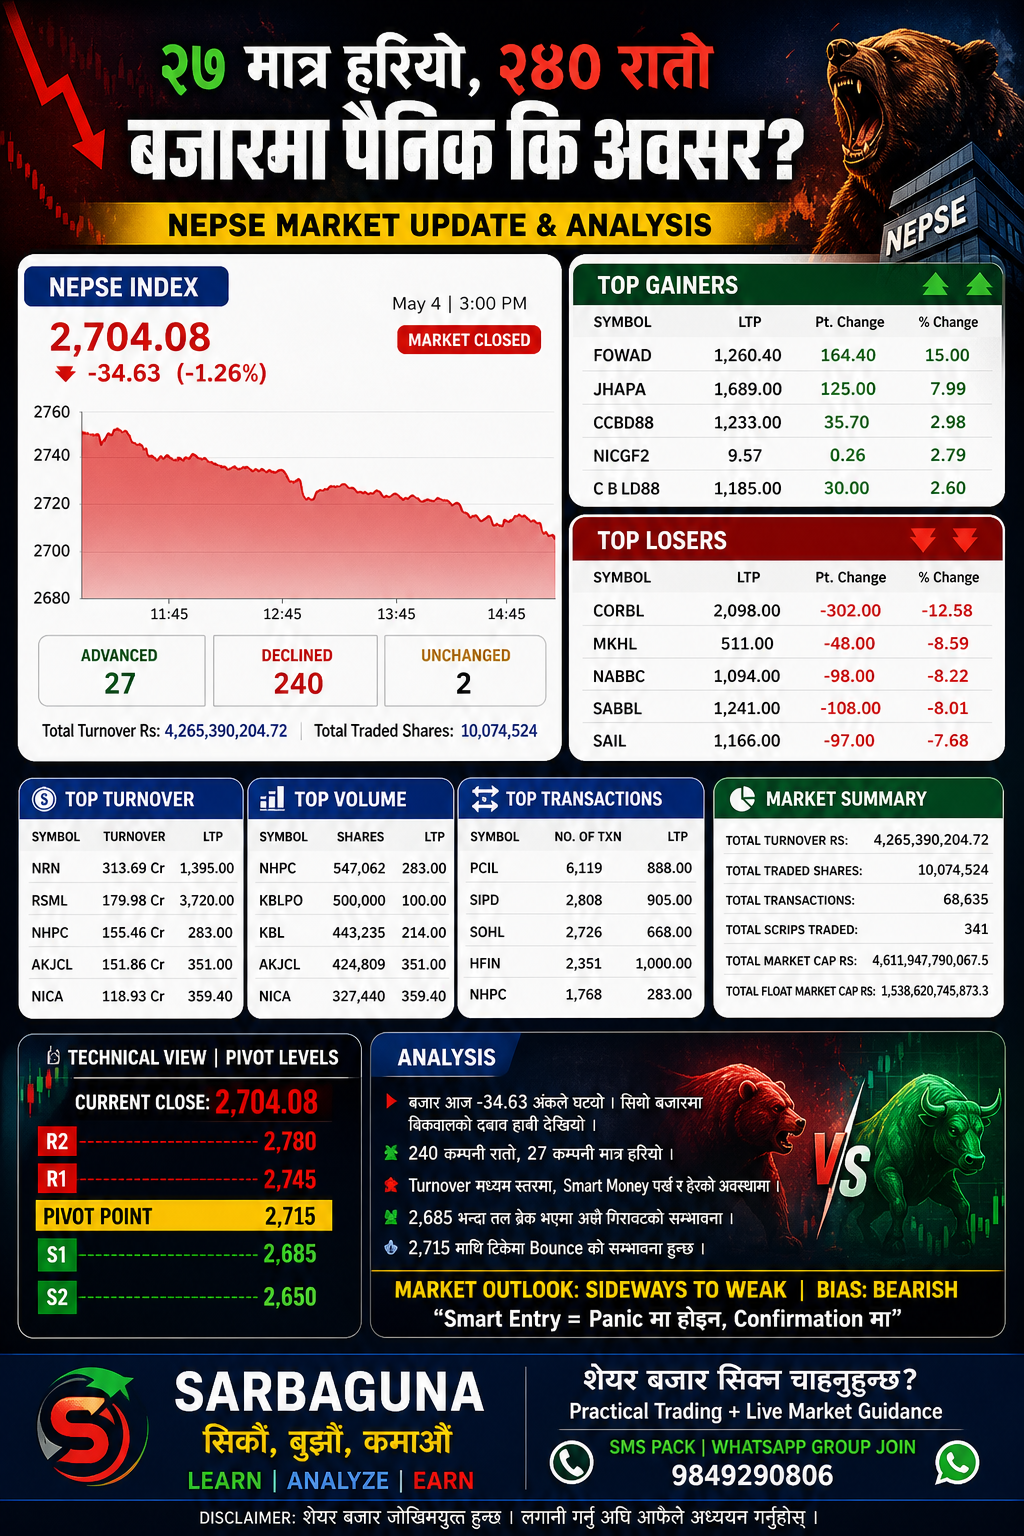
The market has recorded trading turnover of approximately Rs. 4.89 billion, indicating that market participation remains substantial.
However, volume should be evaluated together with price movement. High volume during a breakout can provide stronger confirmation, while high volume without a clear directional move may indicate continued competition between buyers and sellers.
What Could Happen Next in NEPSE?
From a technical-analysis perspective, NEPSE appears to be in a decision-making zone.
The Middle Band is currently an important reference point, while the consecutive Doji candles indicate that traders have not yet established a clear direction.
The next confirmed candle could therefore become important for identifying whether the market is preparing for:
- A bullish continuation
- A short-term correction
- Further sideways consolidation
- A breakout from the current trading range
Traders should avoid interpreting a Doji candle in isolation. Confirmation from subsequent price action, volume and key technical levels can provide a more reliable indication.
NEPSE Technical Analysis: Key Takeaways
The current technical setup can be summarized as follows:
- Consecutive Doji candles indicate market indecision.
- NEPSE is attempting to hold the Bollinger Band Middle Line.
- The Middle Band remains an important short-term support reference.
- A strong bullish candle above the current range could strengthen positive momentum.
- A decisive close below the Middle Band could increase short-term correction risk.
- Trading turnover of around Rs. 4.89 billion shows continued market participation.
- The next few sessions could provide confirmation of the market's short-term direction.
Overall, the current NEPSE chart reflects a phase of consolidation and balance between buyers and sellers. The Doji formation alone does not confirm a reversal. Traders should watch the next confirmed price action around the Bollinger Band Middle Line and combine it with volume and other technical indicators before drawing conclusions.
Learn NEPSE Technical Analysis and Forex Trading in Nepal
Understanding Doji candles, Bollinger Bands, moving averages, support and resistance, RSI, MACD and market structure can help investors develop a more systematic approach to market analysis.
If you want to learn stock market technical analysis in Nepal, explore the Sarbaguna Share Market Training Course.
Sarbaguna also provides learning resources for traders interested in Forex Trading Course in Nepal, technical analysis and practical trading concepts.
For information about NEPSE technical analysis, share market training and Forex trading education in Nepal, contact Deep Thapa — Call/WhatsApp: 9849290806.
FAQ: NEPSE Technical Analysis
1. What does a Doji candle mean in NEPSE?
A Doji candle indicates that the opening and closing prices are relatively close, showing uncertainty or balance between buyers and sellers.
2. Are consecutive Doji candles bullish or bearish?
Consecutive Doji candles do not automatically indicate either a bullish or bearish trend. They primarily show indecision and require confirmation from subsequent price action.
3. What is the Bollinger Band Middle Line?
The Bollinger Band Middle Line is commonly based on a 20-period moving average. Traders often use it as a reference for trend direction and potential support or resistance.
4. Why is the Bollinger Band Middle Line important for NEPSE?
Holding above the Middle Line can indicate that the short-term trend is maintaining support, while a sustained breakdown below it may indicate increasing weakness.
5. What confirms a bullish NEPSE breakout after a Doji?
A strong bullish candle followed by sustained price movement and supportive trading volume can provide stronger confirmation of an upward breakout.
6. What happens if NEPSE falls below the Middle Band?
A sustained decline below the Middle Band may increase the possibility of short-term correction or additional consolidation. Other support levels should then be monitored.
7. Can Doji candles predict a NEPSE reversal?
A Doji can appear before either a reversal or continuation. It should therefore be treated as a signal of indecision rather than a guaranteed reversal signal.
8. Where can I learn technical analysis in Nepal?
Investors can learn technical analysis, NEPSE chart analysis, support and resistance, indicators and trading concepts through Sarbaguna's share market training program.
Call/WhatsApp Deep Thapa: 9849290806
This article is for educational and informational purposes only and should not be considered investment advice.


Leave a Comments
Comments

Popular





Recent Post

No comments yet.