
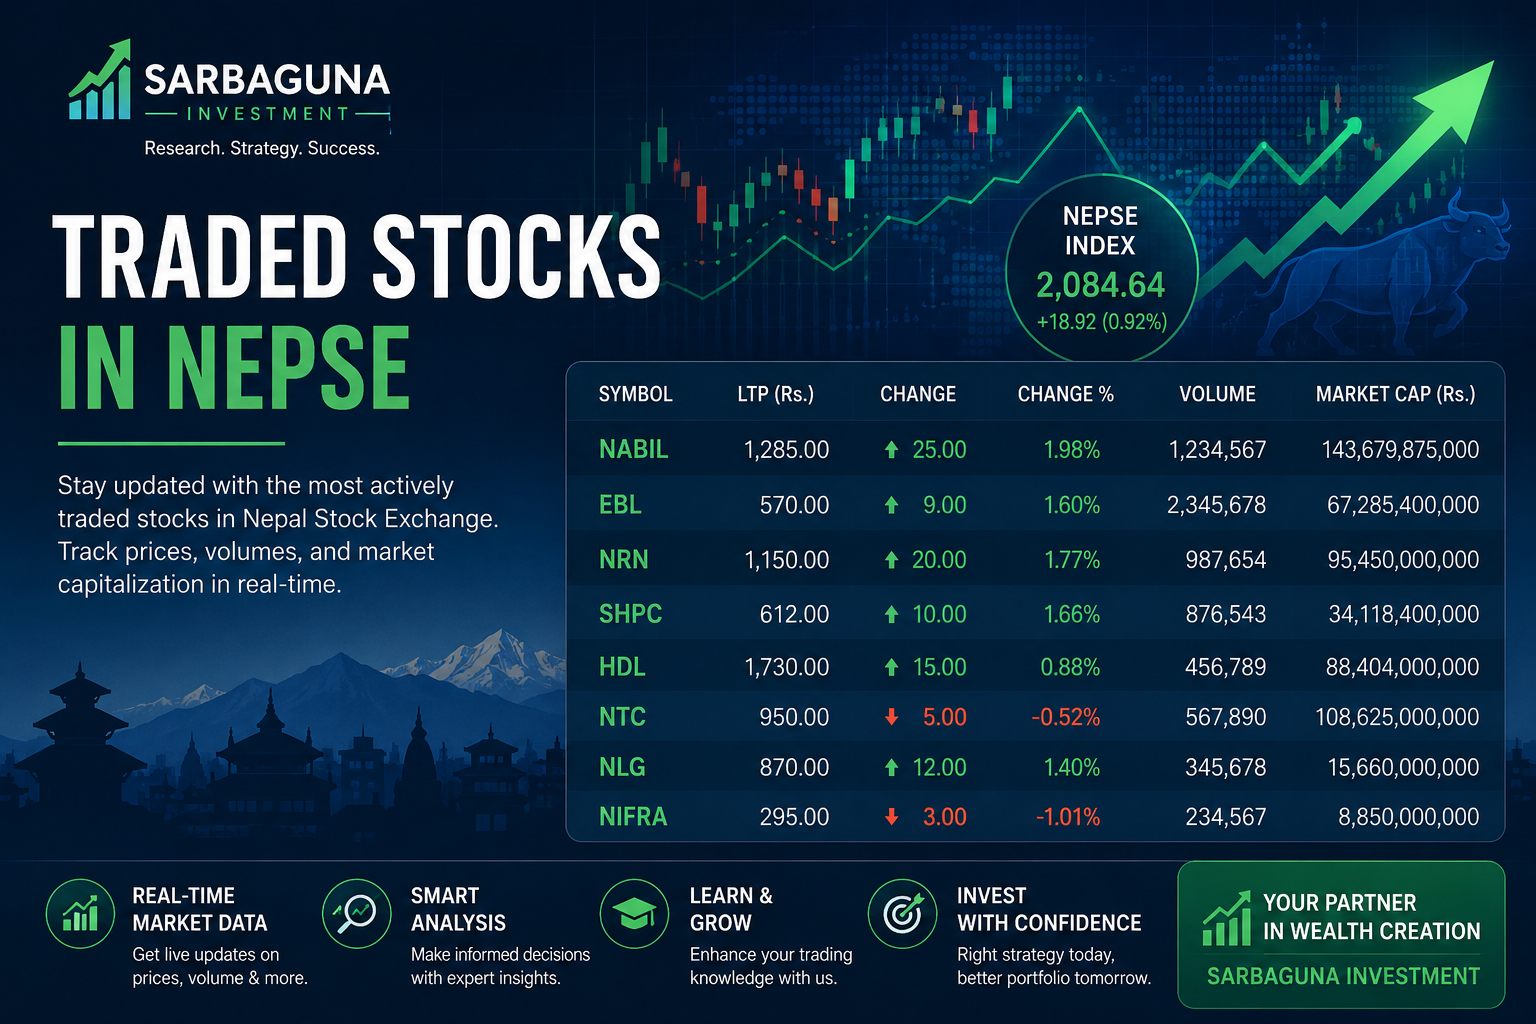
📊 Williams %R vs RSI
Understanding the Key Differences for Smarter Trading
In technical analysis, momentum indicators help traders identify overbought and oversold conditions. Two of the most widely used tools are Williams %R and the Relative Strength Index (RSI). While both serve a similar purpose, their calculation, behavior, and usage differ significantly.
At Sarbaguna Investment, we simplify these concepts so you can make confident trading decisions in NEPSE.
🔍 What is Williams %R?
Williams %R (Williams Percent Range) is a momentum oscillator developed by Larry Williams. It measures where the current closing price stands relative to the highest high over a specific period.
Range: 0 to -100
Overbought: -20 to 0
Oversold: -80 to -100
Focus: Short-term price reversals
👉 It reacts quickly to price changes because it does not use smoothing, making it ideal for fast-moving markets.
📈 What is RSI (Relative Strength Index)?
The RSI, developed by J. Welles Wilder, measures the speed and strength of price movements.
Range: 0 to 100
Overbought: Above 70
Oversold: Below 30
Focus: Trend strength and momentum
👉 RSI uses averaged price gains and losses, making it smoother and more reliable for identifying trend direction.
⚖️ Key Differences Between Williams %R and RSI
1. 📊 Calculation Method
Williams %R: Compares closing price to recent high-low range
RSI: Uses average gains vs losses over time
👉 Result: RSI is smoother, %R is more sensitive
2. 📉 Indicator Range
Williams %R: 0 to -100
RSI: 0 to 100
👉 Different scales, but both indicate momentum extremes
3. ⚡ Sensitivity
Williams %R: Faster signals, more volatile
RSI: Slower signals, more stable
👉 %R is better for quick entries, RSI for trend confirmation
4. 📌 Trading Use Case
Williams %R:
✔ Short-term trades
✔ Reversal spotting
✔ Volatile markets
RSI:
✔ Trend analysis
✔ Swing trading
✔ Filtering noise
5. 🔁 Signal Behavior
Both indicators can stay in overbought/oversold zones during strong trends, so confirmation with other indicators is important.
🧠 Which One Should You Use?
There’s no “better” indicator—it depends on your strategy:
Use Williams %R if you want fast signals and short-term opportunities
Use RSI if you prefer smooth trends and reliable confirmation
👉 Best approach: Combine both indicators for stronger signals and better accuracy.
📊 Sarbaguna Investment Insight
For NEPSE traders, combining RSI + Williams %R + volume analysis can significantly improve your entry and exit timing.
📩 Join Sarbaguna Investment
📊 Sarbaguna Investment
Empowering Smart Trading Decisions in NEPSE
📩 SMS Pack / WhatsApp Group: +977-9849290806
💬 Get daily market updates, trading signals & expert guidance
📈 Learn. Invest. Grow.
— Deep Thapa, Sarbaguna Investment
Tags


Leave a Comments
Comments

Popular


No comments yet.