

Volatility in the Stock Market: Meaning, Types, Calculation & How Investors Can Use It
What is Volatility?
Volatility refers to the degree of price movement of a stock, index, cryptocurrency, or any financial asset over a specific period. When prices fluctuate rapidly with large upward or downward movements, the asset is considered highly volatile. If prices move gradually and remain relatively stable, the asset has low volatility.
Volatility is a natural part of financial markets. It reflects uncertainty, investor sentiment, economic events, and changes in supply and demand. Higher volatility generally indicates greater uncertainty, though it does not necessarily predict whether prices will move upward or downward.
Why Volatility Matters
Understanding volatility helps investors:
- Measure investment risk
- Set realistic profit targets
- Determine stop-loss levels
- Manage portfolio risk
- Identify trading opportunities
- Improve position sizing
Successful traders focus on managing volatility instead of fearing it.
Types of Volatility
1. Historical Volatility
Historical volatility measures how much a stock has moved in the past. It is calculated using previous price data and helps investors understand past market behavior.
Example
If a company's share price regularly moves 5% every day, it has higher historical volatility than one moving only 1% daily.
2. Implied Volatility
Implied volatility represents the market's expectation of future price movements. It is commonly used in options trading and reflects anticipated uncertainty rather than past performance.
What Causes Stock Market Volatility?
Several factors can increase market volatility:
- Company earnings reports
- Economic data releases
- Interest rate decisions
- Inflation
- Political events
- Global conflicts
- Natural disasters
- Investor psychology
- Unexpected news
- Changes in market liquidity
High vs Low Volatility
| High Volatility | Low Volatility |
|---|---|
| Large daily price swings | Small price changes |
| Higher risk | Lower risk |
| More trading opportunities | Stable investing environment |
| Larger profit potential | Consistent long-term growth |
| Bigger drawdowns | Lower emotional stress |
How is Volatility Measured?
Common indicators include:
- Standard Deviation
- Beta
- Average True Range (ATR)
- Bollinger Bands
- VIX (Volatility Index)
Technical traders frequently combine these indicators with price action to evaluate market conditions.
Advantages of Volatility
- Creates trading opportunities
- Allows buying quality stocks at discounts
- Helps active traders capture short-term movements
- Improves portfolio diversification strategies
- Enables better risk management
Disadvantages of Volatility
- Emotional decision-making
- Larger portfolio fluctuations
- Increased investment risk
- Higher probability of stop-loss activation
- Difficult market timing
How Traders Use Volatility
Professional traders often use volatility to:
- Set stop-loss distances
- Determine position size
- Select suitable trading strategies
- Identify breakout opportunities
- Estimate potential price targets
Rather than avoiding volatile markets, experienced traders adapt their risk management to changing market conditions.
Volatility in the Nepal Share Market (NEPSE)
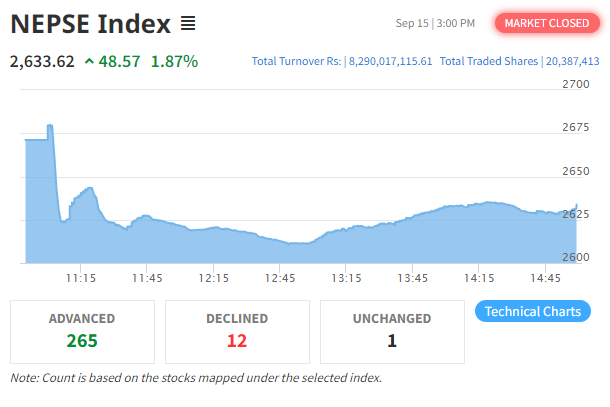
The Nepal Stock Exchange (NEPSE) also experiences periods of high and low volatility. Factors affecting volatility in Nepal include:
- Monetary policy changes
- Nepal Rastra Bank directives
- Company rights and bonus announcements
- Quarterly financial reports
- IPO listings
- Investor sentiment
- Political developments
Understanding these factors helps investors make informed decisions instead of reacting emotionally.
Tips for Managing Volatility
- Diversify your portfolio.
- Invest according to your risk tolerance.
- Use stop-loss orders wisely.
- Avoid emotional buying and selling.
- Follow a disciplined investment plan.
- Focus on long-term goals rather than short-term market noise.
- Continuously improve your market knowledge.
Frequently Asked Questions (FAQ)
What is volatility in simple words?
Volatility measures how much the price of an investment moves up or down over time.
Is high volatility good or bad?
Neither. High volatility means larger price swings, which can create both greater opportunities and greater risks.
What is low volatility?
Low volatility refers to relatively stable prices with smaller daily or weekly fluctuations.
How do traders measure volatility?
Common methods include Standard Deviation, ATR, Bollinger Bands, Beta, and the VIX for broader market expectations.
Can volatility predict future prices?
No. Volatility indicates the magnitude of potential price movements, not their direction.
Why is NEPSE sometimes highly volatile?
Economic news, company announcements, regulatory changes, liquidity, and investor sentiment can all contribute to increased volatility.
Learn Share Market with Sarbaguna
Want to become a confident investor or trader in Nepal?
Join Sarbaguna Share Market Training Nepal to learn:
- NEPSE Technical Analysis
- Price Action Trading
- Candlestick Patterns
- Support & Resistance
- Risk Management
- Swing Trading
- Portfolio Management
- Fundamental Analysis
Visit https://sarbaguna.com for training programs, educational articles, and market resources.
Contact
Deep Thapa
WhatsApp / Call: 9849290806
Tags


Leave a Comments
Comments


Popular






Recent Post
No comments yet.